. 2022 Dec;289(23):7500-7518.
doi: 10.1111/febs.16572. Epub 2022 Jul 18.

Functional mapping of the N-terminal region of the yeast moonlighting protein Sis2/Hal3 reveals crucial residues for Ppz1 regulation

Affiliations

Functional mapping of the N-terminal region of the yeast moonlighting protein Sis2/Hal3 reveals crucial residues for Ppz1 regulation

Carlos Santolaria et al. FEBS J. 2022 Dec.

Abstract

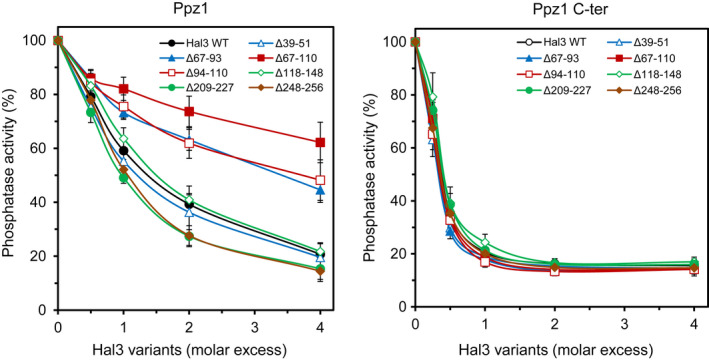
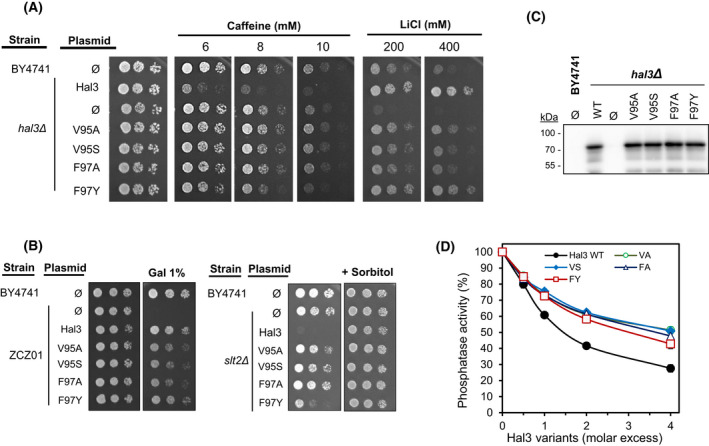
The function of the Saccharomyces cerevisiae Ppz1 phosphatase is controlled by its inhibitory subunit Hal3. Hal3 is a moonlighting protein, which associates with Cab3 to form a decarboxylase involved in the CoA biosynthetic pathway. Hal3 is composed by a conserved core PD region, required for both Ppz1 regulation and CoA biosynthesis, a long N-terminal extension, and an acidic C-terminal tail. Cab3 has a similar structure, but it is not a Ppz1 inhibitor. We show here that deletion or specific mutations in a short region of the N-terminal extension of Hal3 compromise its function as a Ppz1 inhibitor in vivo and in vitro without negatively affecting its ability to interact with the phosphatase. This study defines a R-K-X(3) -VTFS- sequence whose presence explains the unexpected ability of Cab3 (but not Hal3) to regulate Ppz1 function in Candida albicans. This sequence is conserved in a subset of fungi and it could serve to estimate the relevance of Hal3 or Cab3 proteins in regulating fungal Ppz enzymes. We also show that the removal of the motif moderately affects both Ppz1 intracellular relocalization and counteraction of toxicity in cells overexpressing the phosphatase. Thus, our work contributes to our understanding of the regulation of Ppz phosphatases, which are determinants for virulence in some pathogenic fungi.

Keywords: disordered regions; mutagenesis; protein phosphatase; regulatory subunit; yeasts.


Conflict of interest statement

The authors declare no conflict of interest.

Figures

Fig. 1
Fig. 1
Coarse functional mapping of the S. cerevisiae Hal3 N‐terminal extension. (A) Schematic cartoon depicting the regions deleted in the Hal3 N‐terminal disordered domain. The right segment (in red) represents the start of the PD domain. (B) The wild‐type BY4741 strain and its hal3Δ derivative were transformed with the pWS93 vector (Ø) or the same plasmid bearing the native HAL3 gene or the indicated deletion variants. Cultured were spotted as described in material and methods on plates containing synthetic medium lacking uracil and different concentrations of caffeine or LiCl. The same constructs were introduced into cells lacking the Slt2 MAP kinase (slt2Δ, right panel). For slt2Δ cells 10% sorbitol, which acts as osmotic support, was added to the medium as positive growth control). (C) The indicated strains were transformed with pWS93‐based constructs bearing the different variants of Hal3. Protein extracts were prepared and resolved (40 μg) by SDS/PAGE. The expression levels of the various Hal3 versions were examined by immunoblot using anti‐HA antibodies. The experiment was repeated twice with different protein extracts and gave coincident results. The lower panel shows the relevant section of the gel stained with red ponceau to monitor loading and transfer efficiency. Ø denotes empty plasmid. (D) Strain ZCZ01, overexpressing PPZ1 from the strong GAL1‐10 promoter was transformed and cultures spotted as above. Induction of Ppz1 overexpression was achieved by inclusion of 1% galactose (GAL) in 2% raffinose containing plates. Pictures were taken in all cases after 3 days.
Fig. 2
Fig. 2
In vitro Ppz1 inhibitory activity of different Hal3 deletion variants. The Ppz1 phosphatase activity was measured as described in materials and methods using 2–10 pmols of full‐length Ppz1 or 5 pmols of the Ppz1 C‐terminal catalytic domain (Ppz1‐Cter), and pNPP as substrate. The phosphatase was pre‐incubated for 5 min at 30 °C with increasing amounts of native Hal3 or the indicated variants and the assay started by addition of the substrate. Values are means ± SE from at least four different assays and are expressed as the percentage of phosphatase activity relative to the control without inhibitor. At least two different preparations of the phosphatases and the inhibitors were used for these assays. The specific activities of Ppz1 and Ppz1‐Cter preparations were 5.05 ± 0.11 and 5.76 ± 0.09 nmol·min−1 × μg−1 respectively.
Fig. 3
Fig. 3
Functional relevance of the Hal3 67–110 N‐terminal region. (A) The sequence of the region analysed is shown. Specific deletions subjected to functional analysis are denoted by empty boxes. (B, C) Strains containing the indicated constructs were analysed as in Fig. 1. All pictures were taken after 3 days of incubation, except plates containing the slt2Δ strain (4 days). (D) Immunoblot analysis of diverse Hal3 deletions comprising residues 67–110. The indicated strains were transformed with pWS93‐based constructs bearing the different variants of Hal3. The expression levels of the various Hal3 versions were monitored by immunoblot using anti‐HA antibodies as in Fig. 1. Two independent sets of extracts were analysed with equivalent results. Ø denotes empty plasmid, WT, native Hal3. (E) The inhibitory capacity of the indicated Hal3 variants was determined using full‐length recombinant Ppz1 as in Fig. 2. Data are mean ± SE from five different assays using at least two different preparations of the phosphatase and the inhibitors.
Fig. 4
Fig. 4
Mapping of a functional region to Hal3 residues from 90 to 105. (A) Sequence of the region examined. Residues affected by mutations are underlined. (B, C) The phenotypic tests were performed as in Fig. 1. All pictures were taken after 3 days. (D) Immunoblot analysis of diverse changes comprising Hal3 residues 90–105. A representative experiment out of two is shown. See legend to Fig. 1 for details. (E) The ability of the different Hal3 variants to inhibit Ppz1 was tested as in Fig. 2. The mean ± SE from four different assays is shown, including at least two different preparations of Ppz1 and the Hal3 variants.
Fig. 5
Fig. 5
Identification of V95 and F97 as key residues in the N‐terminal extension of Hal3. (A, B) All plates were incubated for 3 days prior documentation. (C) Immunoblot analysis of the indicated variants. Two independent set of extracts were analysed with identical results. (D) Inhibition of Ppz1 is expressed as the mean ± SE from four different assays with at least two different preparations of the phosphatase and the inhibitors.
Fig. 6
Fig. 6
Evaluation of the physical interaction of different Hal3 versions with Ppz1. Equal amounts (6 μg) of GST‐tagged full‐length Ppz1 were immobilized on glutathione beads and used as bait to pull‐down the different variants of Hal3 expressed from the pWS93 plasmid in the strain IM021 (ppz1 hal3). After washing, beads were processed for SDS/PAGE (8% gels) and native Hal3 (WT) and its variants immunodetected by means of their HA‐tag as described in methods (upper panel). The membrane was stained prior transfer with red ponceau to assess similar recovery of the bait in the assay (middle panel). Lower panel. Quantification of the relative Hal3 vs Ppz1 amounts obtained by scanning and integration of immunoblots and recovered GST‐Ppz1 signals (upper and middle panels) from at least six experiments. Data are expressed as the mean ± SE. *P < 0.05, **P < 0.01 according to two‐tailed Student's test.
Fig. 7
Fig. 7
The ability of Hal3 variants in recruiting overexpressed Ppz1 to internal membranes. (A) Micrographs of representative cultures of MAC003 cells (overexpressing C‐terminally GFP tagged Ppz1) bearing an empty pWS93 vector (Ø) or the same vector with native Hal3. Exposition was 3 and 1.5 s respectively. Bars represent 5 μm. (B) MAC003 cultures expressing the indicated Hal3 variants were monitored after 6 h of PPZ1 overexpression and the percentage of cells showing internalized Ppz1 was determined by blind counting of a range between 293 and 813 cells. Ns, not significant *P < 0.05; ***P < 0.001, compared with native Hal3 and determined by two‐tailed Student's test. (C) MAC003 cells were grown overnight on synthetic medium lacking uracil and then transferred to YP raffinose containing 2% galactose at initial OD600 of 0.004. Growth was monitored every 30 min. The mean ± SE from six independent cultures is shown. Ø, empty pWS93 vector.
Fig. 8
Fig. 8
Exchanging relevant N‐terminal regions between C. albicans CaCab3 and CaHal3. (A) Sequence comparison between the 60–111 region of S. cerevisiae Hal3 (NP_012998.1) with the corresponding regions of CaCab3 (XP_717950.1) and CaHal3 (XP_716619.1). Protein sequences were obtained from the NCBI protein databank and alignments were generated with Clustal omega. Residues found in this work to be relevant for the Hal3 regulatory function on Ppz1 are displayed in yellow background. The segments exchanged between CaCab3 and CaHal3 are highlighted in bold and the corresponding region in ScHal3 in italics. B) The different constructs were introduced into the wild‐type BY4741 strain and its hal3 and slt2 derivatives and plated on synthetic medium lacking uracil and supplemented with 8 mM caffeine or 200 mM LiCl (for the hal3 background) or in the presence or absence of 10% sorbitol (for the slt2 background). Plates were incubated in all cases for 3 days. C) The indicated constructs were introduced in the hal3 strain, protein extracts prepared and the level of expression of the native and hybrid proteins was assessed by immunoblot using anti‐HA antibodies. The lower panel shows red ponceau staining of the membrane. Two independent sets of extracts were analysed with similar results.
Fig. 9
Fig. 9
Identification of the regulatory consensus sequence in diverse clades of the order Saccharomycetales. The phylogeny of the selected species was based in the alignment provided in reference [51] and represented using MEGA X software [52]. The identification of the consensus sequences was done by inspection of Clustal Omega alignments and search of FASTA files for degenerate combinations with in‐house developed software. Key consensus residues are denoted in bold. The anomalous sequence in P. kudriavzevii is shaded. An asterisk denotes that the sequence found in the database appears N‐terminally incomplete. (A), Phaffomycetaceae; (B), Pichiaceae; (C), Dipodascaceae.
Fig. 10
Fig. 10
Prediction of intrinsically disordered (IDRs) and folding upon binding regions for the N‐terminal region of S. cerevisiae Hal3. Prediction of IDRs according the IUPred2 software is denoted in red, and prediction of disordered binding regions based in the Anchor2 software in blue. The 0.5 cut‐off (discontinuous line) corresponds to 5% false positive prediction on IDRs or ordered protein segments. The cartoon on the top depicts the position of the major deletions described in our work, as well as the location of the KR‐X3‐VTFS motif. The N‐terminal extension is shown in light blue.

Similar articles

Cited by

References

    1. Brautigan DL. Protein ser/Thr phosphatases–the ugly ducklings of cell signalling. FEBS J. 2013;280:324–5. - PubMed
    1. Ariño J, Velázquez D, Casamayor A. Ser/Thr protein phosphatases in fungi: structure, regulation and function. Microb Cell. 2019;6:217–56. - PMC - PubMed
    1. Posas F, Casamayor A, Morral N, Ariño J. Molecular cloning and analysis of a yeast protein phosphatase with an unusual amino‐terminal region. J Biol Chem. 1992;267:11734–40. - PubMed
    1. Yenush L, Merchan S, Holmes J, Serrano R. pH‐responsive, posttranslational regulation of the Trk1 potassium transporter by the type 1‐related Ppz1 phosphatase. Mol Cell Biol. 2005;25:8683–92. - PMC - PubMed
    1. Posas F, Camps M, Ariño J. The PPZ protein phosphatases are important determinants of salt tolerance in yeast cells. J Biol Chem. 1995;270:13036–41. - PubMed

Publication types

MeSH terms

Substances

Associated data