

KRAS-G12D mutation drives immune suppression and the primary resistance of anti-PD-1/PD-L1 immunotherapy in non-small cell lung cancer
- PMID: 35811500
- PMCID: PMC9456691
- DOI: 10.1002/cac2.12327
KRAS-G12D mutation drives immune suppression and the primary resistance of anti-PD-1/PD-L1 immunotherapy in non-small cell lung cancer
Abstract
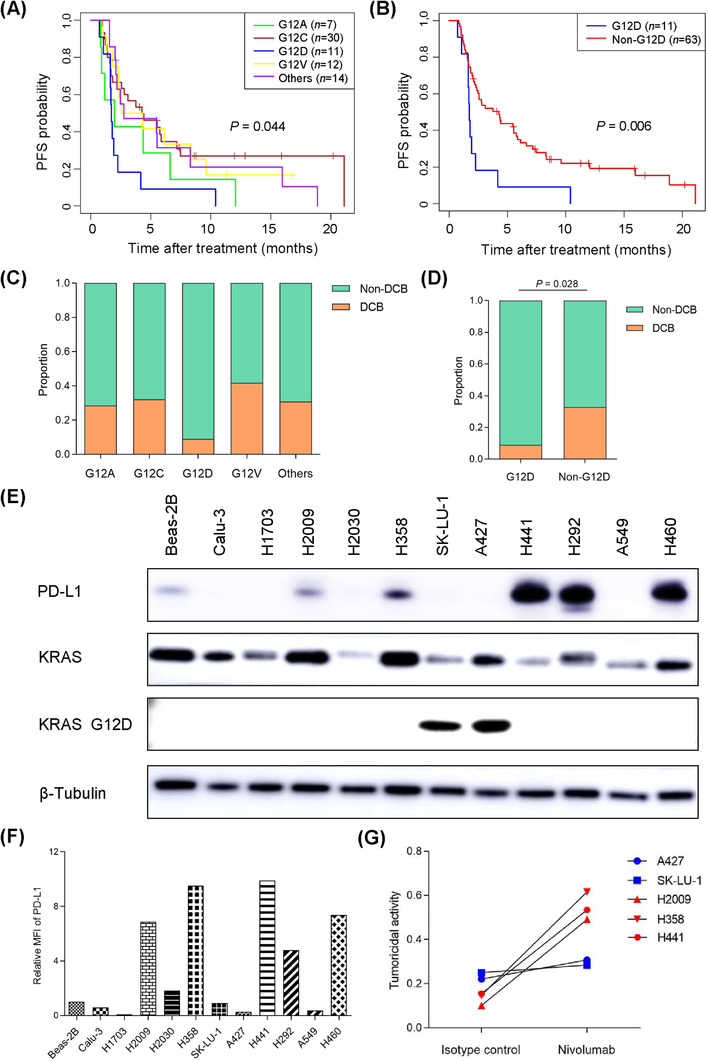
Background: Although immune checkpoint inhibitors (ICIs) against programmed cell death protein 1 (PD-1) and its ligand PD-L1 have demonstrated potency towards treating patients with non-small cell lung carcinoma (NSCLC), the potential association between Kirsten rat sarcoma viral oncogene homolog (KRAS) oncogene substitutions and the efficacy of ICIs remains unclear. In this study, we aimed to find point mutations in the KRAS gene resistant to ICIs and elucidate resistance mechanism.
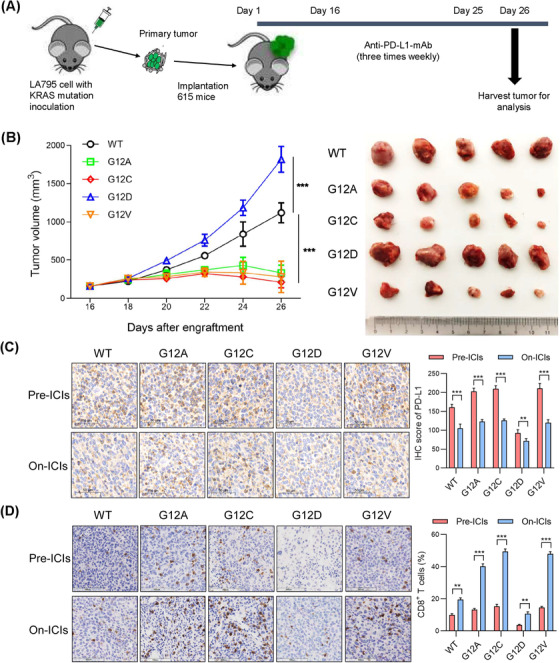
Methods: The association between KRAS variant status and the efficacy of ICIs was explored with a clinical cohort (n = 74), and confirmed with a mouse model. In addition, the tumor immune microenvironment (TIME) of KRAS-mutant NSCLC, such as CD8+ tumor-infiltrating lymphocytes (TILs) and PD-L1 level, was investigated. Cell lines expressing classic KRAS substitutions were used to explore signaling pathway activation involved in the formation of TIME. Furthermore, interventions that improved TIME were developed to increase responsiveness to ICIs.
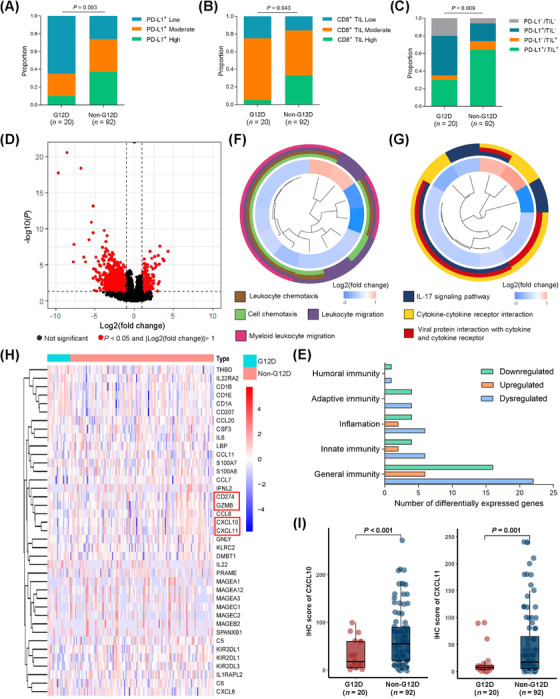
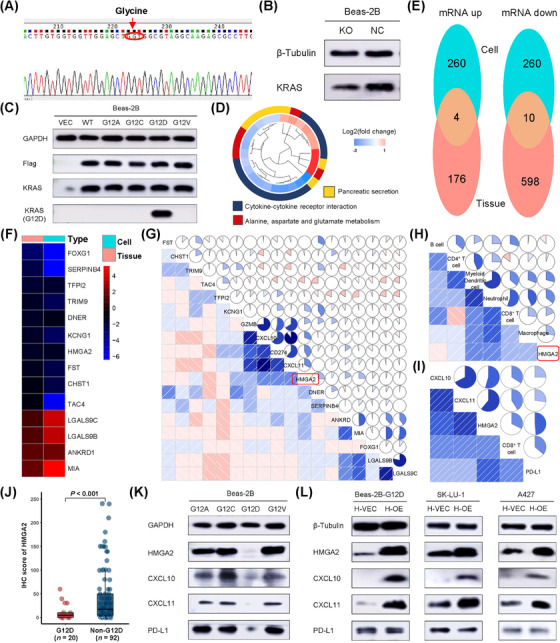
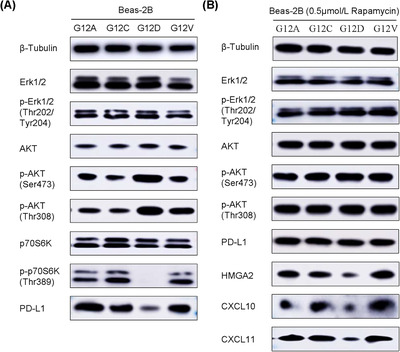
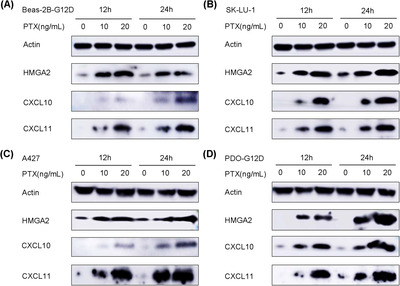
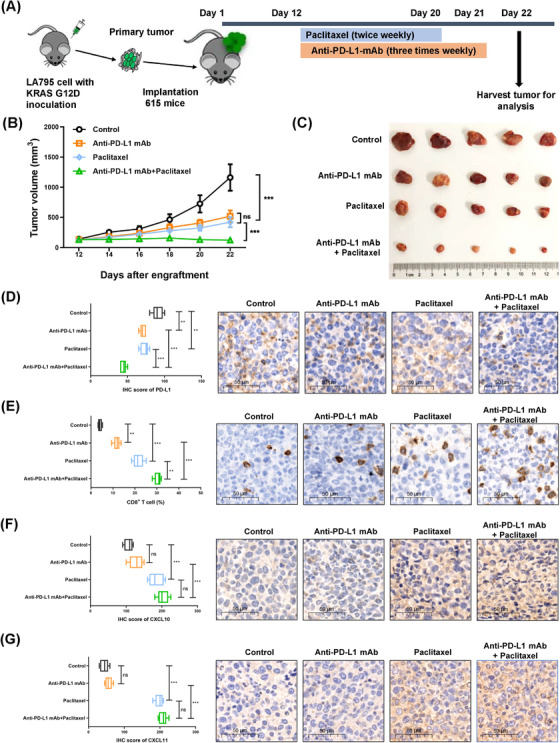
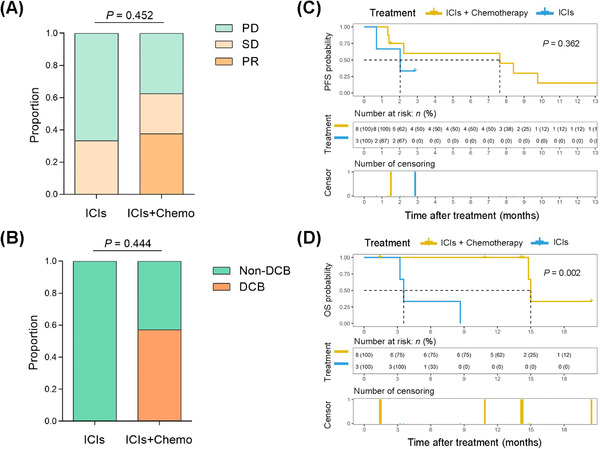
Results: We observed the inferior efficacy of ICIs in KRAS-G12D-mutant NSCLC. Based upon transcriptome data and immunostaining results from KRAS-mutant NSCLC, KRAS-G12D point mutation negatively correlated with PD-L1 level and secretion of chemokines CXCL10/CXCL11 that led to a decrease in CD8+ TILs, which in turn yielded an immunosuppressive TIME. The analysis of cell lines overexpressing classic KRAS substitutions further revealed that KRAS-G12D mutation suppressed PD-L1 level via the P70S6K/PI3K/AKT axis and reduced CXCL10/CXCL11 levels by down-regulating high mobility group protein A2 (HMGA2) level. Notably, paclitaxel, a chemotherapeutic agent, upregulated HMGA2 level, and in turn, stimulated the secretion of CXCL10/CXCL11. Moreover, PD-L1 blockade combined with paclitaxel significantly suppressed tumor growth compared with PD-L1 inhibitor monotherapy in a mouse model with KRAS-G12D-mutant lung adenocarcinoma. Further analyses revealed that the combined treatment significantly enhanced the recruitment of CD8+ TILs via the up-regulation of CXCL10/CXCL11 levels. Results of clinical study also revealed the superior efficacy of chemo-immunotherapy in patients with KRAS-G12D-mutant NSCLC compared with ICI monotherapy.
Conclusions: Our study elucidated the molecular mechanism by which KRAS-G12D mutation drives immunosuppression and enhances resistance of ICIs in NSCLC. Importantly, our findings demonstrate that ICIs in combination with chemotherapy may be more effective in patients with KRAS-G12D-mutant NSCLC.
Keywords: KRAS-G12D; PD-L1; chemo-immunotherapy; immunotherapy; non-small cell lung carcinoma; tumor-infiltrating lymphocyte.
© 2022 The Authors. Cancer Communications published by John Wiley & Sons Australia, Ltd. on behalf of Sun Yat-sen University Cancer Center.
Conflict of interest statement
The authors declare that they have no competing interests.
Figures
Similar articles
-
Molecular heterogeneity of anti-PD-1/PD-L1 immunotherapy efficacy is correlated with tumor immune microenvironment in East Asian patients with non-small cell lung cancer.Cancer Biol Med. 2020 Aug 15;17(3):768-781. doi: 10.20892/j.issn.2095-3941.2020.0121. Cancer Biol Med. 2020. PMID: 32944405 Free PMC article.
-
Efficacy of Immune Checkpoint Inhibitors in KRAS-Mutant Non-Small Cell Lung Cancer (NSCLC).J Thorac Oncol. 2019 Jun;14(6):1095-1101. doi: 10.1016/j.jtho.2019.01.011. Epub 2019 Feb 6. J Thorac Oncol. 2019. PMID: 30738221
-
The superior efficacy of anti-PD-1/PD-L1 immunotherapy in KRAS-mutant non-small cell lung cancer that correlates with an inflammatory phenotype and increased immunogenicity.Cancer Lett. 2020 Feb 1;470:95-105. doi: 10.1016/j.canlet.2019.10.027. Epub 2019 Oct 20. Cancer Lett. 2020. PMID: 31644929
-
Decoding KRAS mutation in non-small cell lung cancer patients receiving immunotherapy: A retrospective institutional comparison and literature review.Lung Cancer. 2025 Jan;199:108051. doi: 10.1016/j.lungcan.2024.108051. Epub 2024 Dec 9. Lung Cancer. 2025. PMID: 39740426 Review.
-
Programmed death-ligand 1 expression in non-small cell lung carcinoma - mechanism of regulation, association with other markers, and therapeutic implication.Klin Onkol. 2022 Fall;35(5):372-376. doi: 10.48095/ccko2022372. Klin Onkol. 2022. PMID: 36443097 Review. English.
Cited by
-
Combination of mutations in genes controlling DNA repair and high mutational load plays a prognostic role in pancreatic ductal adenocarcinoma (PDAC): a retrospective real-life study in Sardinian population.J Transl Med. 2024 Jan 27;22(1):108. doi: 10.1186/s12967-024-04923-3. J Transl Med. 2024. PMID: 38280995 Free PMC article.
-
Identification of shared immune infiltration characteristic molecules in dermatomyositis and nasopharyngeal carcinoma using bioinformatics: Traits in dermatomyositis and nasopharyngeal cancer.Skin Res Technol. 2024 Aug;30(8):e13871. doi: 10.1111/srt.13871. Skin Res Technol. 2024. PMID: 39081134 Free PMC article.
-
PCK2 inhibits lung adenocarcinoma tumor cell immune escape through oxidative stress-induced senescence as a potential therapeutic target.J Thorac Dis. 2023 May 30;15(5):2601-2615. doi: 10.21037/jtd-23-542. Epub 2023 May 24. J Thorac Dis. 2023. PMID: 37324064 Free PMC article.
-
Clinical perspectives on the value of testing for STK11 and KEAP1 mutations in advanced NSCLC.Front Oncol. 2024 Dec 5;14:1459737. doi: 10.3389/fonc.2024.1459737. eCollection 2024. Front Oncol. 2024. PMID: 39703851 Free PMC article.
-
Immune-related gene signature associates with immune landscape and predicts prognosis accurately in patients with skin cutaneous melanoma.Front Genet. 2023 Jan 4;13:1095867. doi: 10.3389/fgene.2022.1095867. eCollection 2022. Front Genet. 2023. PMID: 36685954 Free PMC article.
References
-
- Siegel RL, Miller KD, Jemal A. Cancer statistics. CA Cancer J Clin. 2019;69(1):7‐34. - PubMed
-
- Travis WD, Brambilla E, Nicholson AG, Yatabe Y, Austin JHM, Beasley MB, et al. The 2015 World Health Organization Classification of Lung Tumors: Impact of Genetic, Clinical and Radiologic Advances Since the 2004 Classification. J Thorac Oncol. 2015;10(9):1243‐60. - PubMed
-
- Duma N, Santana‐Davila R, Molina JR. Non‐Small Cell Lung Cancer: Epidemiology, Screening, Diagnosis, and Treatment. Mayo Clin Proc. 2019;94(8):1623‐40. - PubMed
MeSH terms
Substances
LinkOut - more resources
Full Text Sources
Medical
Research Materials
Miscellaneous
