

Plasmodium knowlesi Cytoadhesion Involves SICA Variant Proteins
- PMID: 35811680
- PMCID: PMC9260704
- DOI: 10.3389/fcimb.2022.888496
Plasmodium knowlesi Cytoadhesion Involves SICA Variant Proteins
Abstract
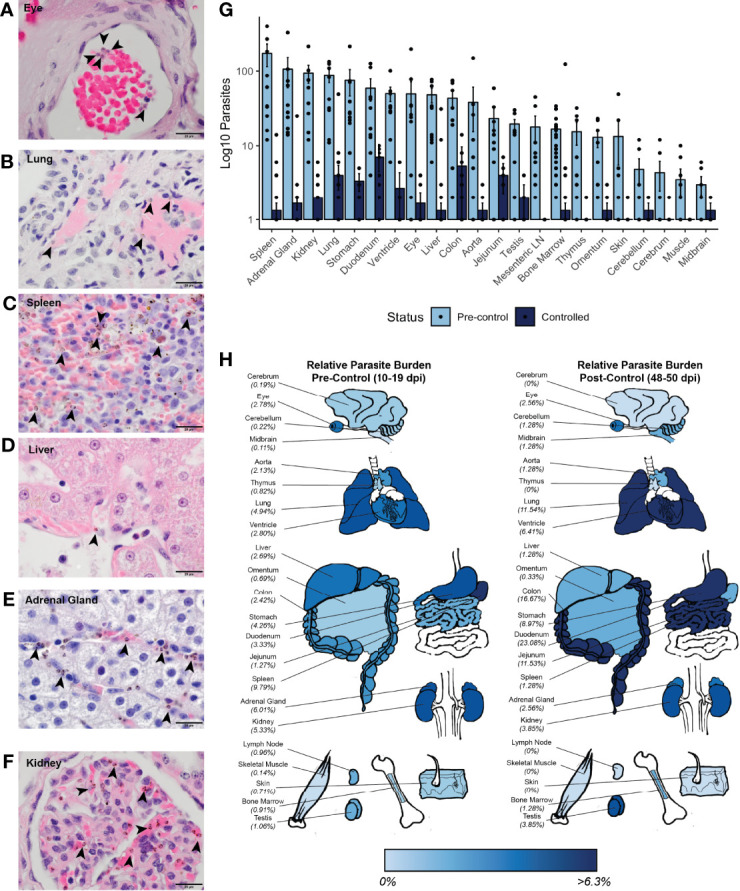
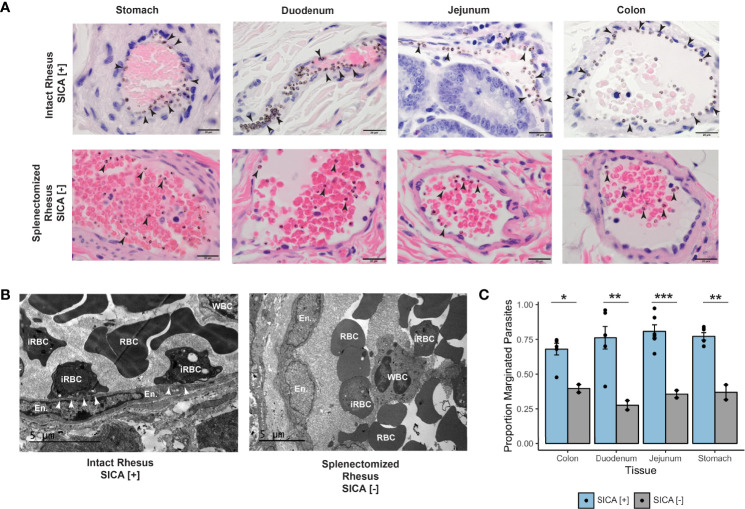
Plasmodium knowlesi poses a health threat throughout Southeast Asian communities and currently causes most cases of malaria in Malaysia. This zoonotic parasite species has been studied in Macaca mulatta (rhesus monkeys) as a model for severe malarial infections, chronicity, and antigenic variation. The phenomenon of Plasmodium antigenic variation was first recognized during rhesus monkey infections. Plasmodium-encoded variant proteins were first discovered in this species and found to be expressed at the surface of infected erythrocytes, and then named the Schizont-Infected Cell Agglutination (SICA) antigens. SICA expression was shown to be spleen dependent, as SICA expression is lost after P. knowlesi is passaged in splenectomized rhesus. Here we present data from longitudinal P. knowlesi infections in rhesus with the most comprehensive analysis to date of clinical parameters and infected red blood cell sequestration in the vasculature of tissues from 22 organs. Based on the histopathological analysis of 22 tissue types from 11 rhesus monkeys, we show a comparative distribution of parasitized erythrocytes and the degree of margination of the infected erythrocytes with the endothelium. Interestingly, there was a significantly higher burden of parasites in the gastrointestinal tissues, and extensive margination of the parasites along the endothelium, which may help explain gastrointestinal symptoms frequently reported by patients with P. knowlesi malarial infections. Moreover, this margination was not observed in splenectomized rhesus that were infected with parasites not expressing the SICA proteins. This work provides data that directly supports the view that a subpopulation of P. knowlesi parasites cytoadheres and sequesters, likely via SICA variant antigens acting as ligands. This process is akin to the cytoadhesive function of the related variant antigen proteins, namely Erythrocyte Membrane Protein-1, expressed by Plasmodium falciparum.
Keywords: Plasmodium falciparum; anemia; antigenic variation; gastritis; histopathology (HPE); infected erythrocytes; malaria; rhesus monkey (Macaca mulatta).
Copyright © 2022 Peterson, Joyner, Lapp, Brady, Wood, Cabrera-Mora, Saney, Fonseca, Cheng, Jiang, Soderberg, Nural, Hankus, Machiah, Karpuzoglu, DeBarry, MaHPIC-Consortium, Tirouvanziam, Kissinger, Moreno, Gumber, Voit, Gutierrez, Cordy and Galinski.
Conflict of interest statement
The authors declare that the research was conducted in the absence of any commercial or financial relationships that could be construed as a potential conflict of interest.
Figures
Similar articles
-
Splenic requirement for antigenic variation and expression of the variant antigen on the erythrocyte membrane in cloned Plasmodium knowlesi malaria.Infect Immun. 1983 Jun;40(3):985-94. doi: 10.1128/iai.40.3.985-994.1983. Infect Immun. 1983. PMID: 6189787 Free PMC article.
-
Altered expression of Plasmodium knowlesi variant antigen on the erythrocyte membrane in splenectomized rhesus monkeys.J Immunol. 1982 Jan;128(1):224-6. J Immunol. 1982. PMID: 6172478
-
Spleen-dependent regulation of antigenic variation in malaria parasites: Plasmodium knowlesi SICAvar expression profiles in splenic and asplenic hosts.PLoS One. 2013 Oct 18;8(10):e78014. doi: 10.1371/journal.pone.0078014. eCollection 2013. PLoS One. 2013. PMID: 24205067 Free PMC article.
-
Plasmodium knowlesi: a superb in vivo nonhuman primate model of antigenic variation in malaria.Parasitology. 2018 Jan;145(1):85-100. doi: 10.1017/S0031182017001135. Epub 2017 Jul 17. Parasitology. 2018. PMID: 28712361 Free PMC article. Review.
-
Antigenic variation of bloodstage malaria parasites.Philos Trans R Soc Lond B Biol Sci. 1984 Nov 13;307(1131):141-58. doi: 10.1098/rstb.1984.0115. Philos Trans R Soc Lond B Biol Sci. 1984. PMID: 6151679 Review.
Cited by
-
Proteomes of plasmodium knowlesi early and late ring-stage parasites and infected host erythrocytes.J Proteomics. 2024 Jun 30;302:105197. doi: 10.1016/j.jprot.2024.105197. Epub 2024 May 15. J Proteomics. 2024. PMID: 38759952 Free PMC article.
-
Systems biology of malaria explored with nonhuman primates.Malar J. 2022 Jun 7;21(1):177. doi: 10.1186/s12936-022-04199-2. Malar J. 2022. PMID: 35672852 Free PMC article. Review.
-
Characterization and microRNA quantification of plasma-derived extracellular vesicles in patients with Plasmodium knowlesi infection.Parasitology. 2025 Apr;152(4):381-394. doi: 10.1017/S0031182025000423. Parasitology. 2025. PMID: 40134311 Free PMC article.
-
Animal Models of Malaria-Associated Acute Kidney Injury.Semin Nephrol. 2025 May;45(3):151616. doi: 10.1016/j.semnephrol.2025.151616. Epub 2025 May 15. Semin Nephrol. 2025. PMID: 40374463 Review.
-
Plasmodium knowlesi (Pk) Malaria: A Review & Proposal of Therapeutically Rational Exchange (T-REX) of Pk-Resistant Red Blood Cells.Trop Med Infect Dis. 2023 Oct 20;8(10):478. doi: 10.3390/tropicalmed8100478. Trop Med Infect Dis. 2023. PMID: 37888606 Free PMC article. Review.
References
-
- Aikawa M., Kamanura K., Shiraishi S., Matsumoto Y., Arwati H., Torii M., et al. . (1996). Membrane Knobs of Unfixed Plasmodium Falciparum Infected Erythrocytes: New Findings as Revealed by Atomic Force Microscopy and Surface Potential Spectroscopy. Exp. Parasitol. 84, 339–343. doi: 10.1006/expr.1996.0122 - DOI - PubMed
-
- Akinyi S., Hanssen E., Meyer E. V., Jiang J., Korir C. C., Singh B., et al. . (2012). A 95 kDa Protein of Plasmodium Vivax and P. Cynomolgi Visualized by Three-Dimensional Tomography in the Caveola-Vesicle Complexes (Schuffner's Dots) of Infected Erythrocytes is a Member of the PHIST Family. Mol. Microbiol. 84, 816–831. doi: 10.1111/j.1365-2958.2012.08060.x - DOI - PMC - PubMed
Publication types
MeSH terms
Substances
Grants and funding
LinkOut - more resources
Full Text Sources
Medical
Research Materials