

Development and Validation of a Nomogram-Based Prognostic Model to Predict High Blood Pressure in Children and Adolescents-Findings From 342,736 Individuals in China
- PMID: 35811689
- PMCID: PMC9260112
- DOI: 10.3389/fcvm.2022.884508
Development and Validation of a Nomogram-Based Prognostic Model to Predict High Blood Pressure in Children and Adolescents-Findings From 342,736 Individuals in China
Abstract
Objectives: Predicting the potential risk factors of high blood pressure (HBP) among children and adolescents is still a knowledge gap. Our study aimed to establish and validate a nomogram-based model for identifying youths at risk of developing HBP.
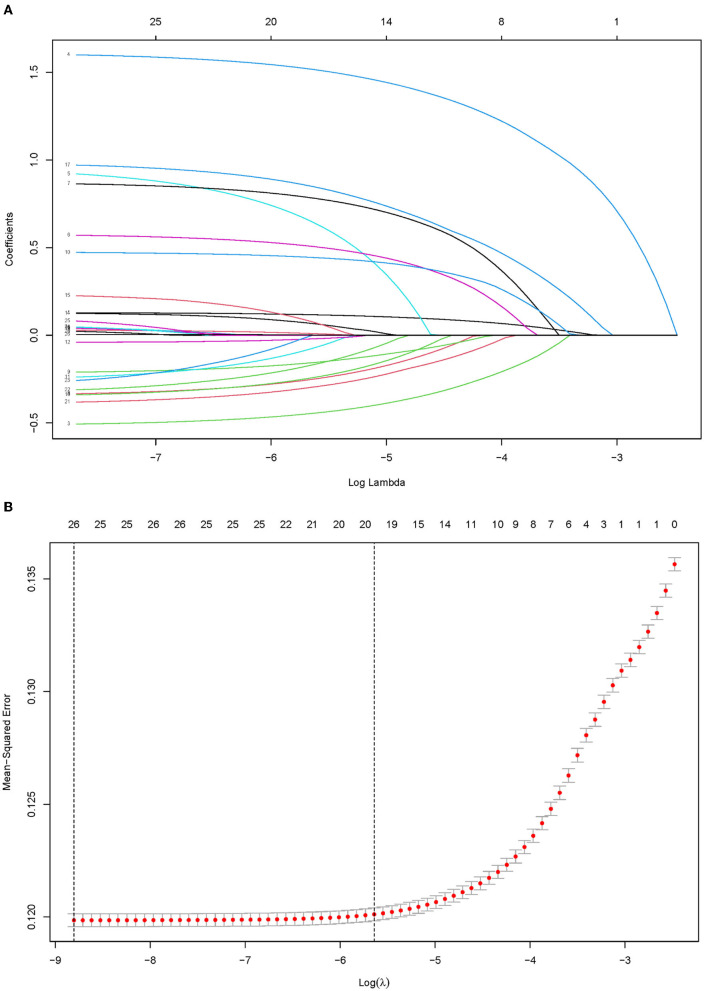
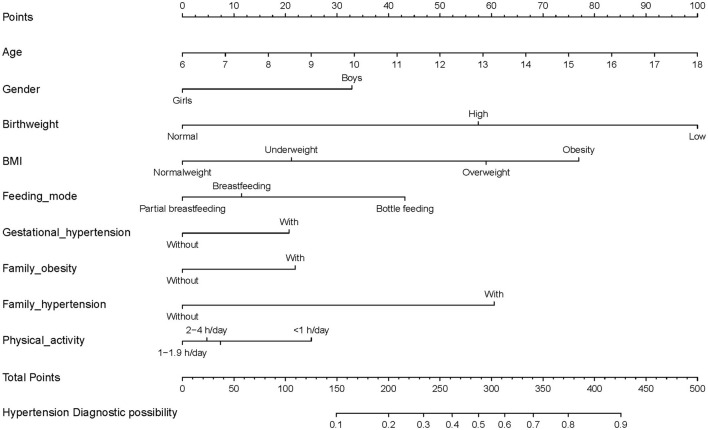
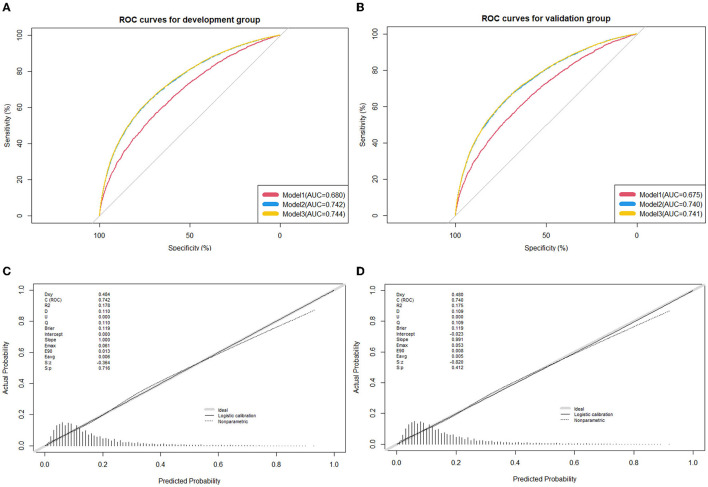
Methods: HBP was defined as systolic blood pressure or diastolic blood pressure above the 95th percentile, using age, gender, and height-specific cut-off points. Penalized regression with Lasso was used to identify the strongest predictors of HBP. Internal validation was conducted by a 5-fold cross-validation and bootstrapping approach. The predictive variables and the advanced nomogram plot were identified by conducting univariate and multivariate logistic regression analyses. A nomogram was constructed by a training group comprised of 239,546 (69.9%) participants and subsequently validated by an external group with 103,190 (30.1%) participants.
Results: Of 342,736 children and adolescents, 55,480 (16.2%) youths were identified with HBP with mean age 11.51 ± 1.45 years and 183,487 were boys (53.5%). Nine significant relevant predictors were identified including: age, gender, weight status, birth weight, breastfeeding, gestational hypertension, family history of obesity and hypertension, and physical activity. Acceptable discrimination [area under the receiver operating characteristic curve (AUC): 0.742 (development group), 0.740 (validation group)] and good calibration (Hosmer and Lemeshow statistics, P > 0.05) were observed in our models. An available web-based nomogram was built online on https://hbpnomogram.shinyapps.io/Dyn_Nomo_HBP/.
Conclusions: This model composed of age, gender, early life factors, family history of the disease, and lifestyle factors may predict the risk of HBP among youths, which has developed a promising nomogram that may aid in more accurately identifying HBP among youths in primary care.
Keywords: children and adolescents; cross-sectional study; high blood pressure; nomogram; risk classification.
Copyright © 2022 Liang, Zhao, Chen, Huang, Zhang, Jiang, Kakaer and Chen.
Conflict of interest statement
The authors declare that the research was conducted in the absence of any commercial or financial relationships that could be construed as a potential conflict of interest.
Figures
Similar articles
-
An Externally Validated Dynamic Nomogram for Predicting Unfavorable Prognosis in Patients With Aneurysmal Subarachnoid Hemorrhage.Front Neurol. 2021 Aug 26;12:683051. doi: 10.3389/fneur.2021.683051. eCollection 2021. Front Neurol. 2021. PMID: 34512505 Free PMC article.
-
Development and validation of a nomogram to predict plastic bronchitis in children with refractory Mycoplasma pneumoniae pneumonia.BMC Pulm Med. 2022 Jun 27;22(1):253. doi: 10.1186/s12890-022-02047-2. BMC Pulm Med. 2022. PMID: 35761218 Free PMC article.
-
Nomogram to predict the risk of acute kidney injury in patients with diabetic ketoacidosis: an analysis of the MIMIC-III database.BMC Endocr Disord. 2021 Mar 4;21(1):37. doi: 10.1186/s12902-021-00696-8. BMC Endocr Disord. 2021. PMID: 33663489 Free PMC article.
-
A New Scoring System for Predicting In-hospital Death in Patients Having Liver Cirrhosis With Esophageal Varices.Front Med (Lausanne). 2021 Oct 11;8:678646. doi: 10.3389/fmed.2021.678646. eCollection 2021. Front Med (Lausanne). 2021. PMID: 34708050 Free PMC article.
-
Development, validation, and visualization of a web-based nomogram to predict 5-year mortality risk in older adults with hypertension.BMC Geriatr. 2022 May 4;22(1):392. doi: 10.1186/s12877-022-03087-3. BMC Geriatr. 2022. PMID: 35509033 Free PMC article.
Cited by
-
Body Mass Index (BMI) Is the Strongest Predictor of Systemic Hypertension and Cardiac Mass in a Cohort of Children.Nutrients. 2023 Dec 12;15(24):5079. doi: 10.3390/nu15245079. Nutrients. 2023. PMID: 38140337 Free PMC article.
-
Association of the Triglyceride-Glucose Index With Resistant Hypertension and a Nomogram Model Construction.J Am Heart Assoc. 2024 Oct;13(19):e034136. doi: 10.1161/JAHA.123.034136. Epub 2024 Sep 18. J Am Heart Assoc. 2024. PMID: 39291489 Free PMC article.
-
Relationship between occupational noise exposure and hypertension: Cross-sectional evidence from real-world.Front Public Health. 2022 Dec 12;10:1037246. doi: 10.3389/fpubh.2022.1037246. eCollection 2022. Front Public Health. 2022. PMID: 36620292 Free PMC article.
-
A nomogram model for predicting preoperative DVT in elderly anemic patients undergoing total hip arthroplasty: a retrospective cohort study.Thromb J. 2025 Feb 10;23(1):12. doi: 10.1186/s12959-025-00698-9. Thromb J. 2025. PMID: 39930504 Free PMC article.
-
Development of a User-Friendly Self-Screening Tool for Assessing Metabolic Syndrome Risk in Youths from Economically Challenged Regions.J Pers Med. 2024 Jul 30;14(8):810. doi: 10.3390/jpm14080810. J Pers Med. 2024. PMID: 39202001 Free PMC article.
References
-
- Lim SS, Vos T, Flaxman AD, Danaei G, Shibuya K, Adair-Rohani H, et al. . A comparative risk assessment of burden of disease and injury attributable to 67 risk factors and risk factor clusters in 21 regions, 1990-2010: a systematic analysis for the Global burden of disease study 2010. LANCET. (2012) 380:2224–60. 10.1016/S0140-6736(12)61766-8 - DOI - PMC - PubMed
LinkOut - more resources
Full Text Sources
Miscellaneous