. 2022 Jun 20;7(26):22754-22772.
doi: 10.1021/acsomega.2c02277. eCollection 2022 Jul 5.

Genome-wide Meta-analysis Reveals New Gene Signatures and Potential Drug Targets of Hypertension

Affiliations

Genome-wide Meta-analysis Reveals New Gene Signatures and Potential Drug Targets of Hypertension

Fawad Ali et al. ACS Omega. .

Abstract

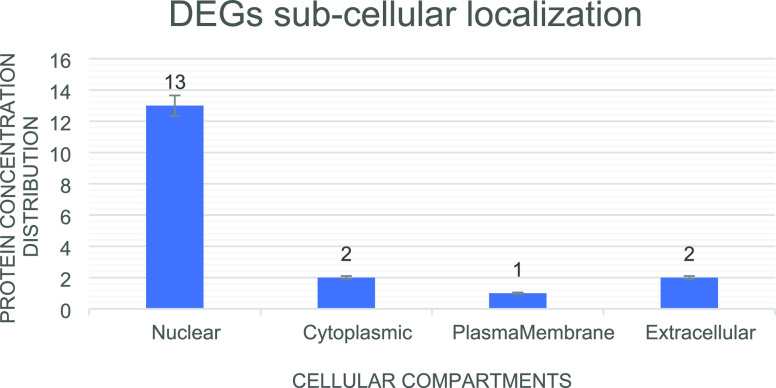
The prevalence of hypertension reported around the world is increasing and is an important public health challenge. This study was designed to explore the disease's genetic variations and to identify new hypertension-related genes and target proteins. We analyzed 22 publicly available Affymetrix cDNA datasets of hypertension using an integrated system-level framework involving differential expression genetic (DEG) analysis, data mining, gene enrichment, protein-protein interaction, microRNA analysis, toxicogenomics, gene regulation, molecular docking, and simulation studies. We found potential DEGs after screening out the extracellular proteins. We studied the functional role of seven shortlisted DEGs (ADM, EDN1, ANGPTL4, NFIL3, MSR1, CEBPD, and USP8) in hypertension after disease gene curation analysis. The expression profiling and cluster analysis showed significant variations and enriched GO terms. hsa-miR-365a-3p, hsa-miR-2052, hsa-miR-3065-3p, hsa-miR-603, hsa-miR-7113-3p, hsa-miR-3923, and hsa-miR-524-5p were identified as hypertension-associated miRNA targets for each gene using computational algorithms. We found functional interactions of source DEGs with target and important gene signatures including EGFR, AGT, AVP, APOE, RHOA, SRC, APOB, STAT3, UBC, LPL, APOA1, and AKT1 associated with the disease. These DEGs are mainly involved in fatty acid metabolism, myometrial pathways, MAPK, and G-alpha signaling pathways linked with hypertension pathogenesis. We predicted significantly disordered regions of 71.2, 48.8, and 45.4% representing the mutation in the sequence of NFIL3, USP8, and ADM, respectively. Regulation of gene expression was performed to find upregulated genes. Molecular docking analysis was used to evaluate Food and Drug Administration-approved medicines against the four DEGs that were overexpressed. For each elevated target protein, the three best drug candidates were chosen. Furthermore, molecular dynamics (MD) simulation using the target's active sites for 100 ns was used to validate these 12 complexes after docking. This investigation establishes the worth of systems genetics for finding four possible genes as potential drug targets for hypertension. These network-based approaches are significant for finding genetic variant data, which will advance the understanding of how to hasten the identification of drug targets and improve the understanding regarding the treatment of hypertension.


Conflict of interest statement

The authors declare no competing financial interest.

Figures

Figure 1
Figure 1
Schematic diagram and framework of the study.
Figure 2
Figure 2
Normalization and differential analysis. The histogram shows the density of the data analyzed. Normally, the proportions of the clusters have comparable shapes. Significant levels of background shifted the intensities of the different arrays toward the right.
Figure 3
Figure 3
RNA degradation plot produced by the AffyRNAdeg representation 5′ to 3′ pattern, indicating an assessment of the degradation and severity level.
Figure 4
Figure 4
Subcellular localization of differential expressed genes and DEG distribution among the cellular compartments.
Figure 5
Figure 5
Disease–gene curation. The bar graph indicates the disease–gene mapping (hypertension-potential genes) using online databases.
Figure 6
Figure 6
Cluster analysis of seven hypertension-related DEGs with Euclidean distance (binning method: quantile lines show the limits of the clusters in the degree of the tree).
Figure 7
Figure 7
Pathway enrichment analysis indicates the percentage of DEGs in the biological pathway using FunRich tool.
Figure 8
Figure 8
Mutation analysis indicates the post-translational change in human genes/proteins using the ActiveDriverDB database. Needle plots demonstrate the PTM sites in our proteins (shown in legend color codes). The y axis indicates the mutation count while the x axis demonstrates the position of the amino acid sequence. Pinhead shading means the mutation effect, and x axis shading shows the kind of PTM related to the mutation area.
Figure 9
Figure 9
Gene network analysis. (A) Protein–protein interaction network. Interaction of seeder/source nodes (light pink) with target nodes (light gray). (B) Topological properties of the network were analyzed by a network analyzer. (C) Disease–gene mapping.
Figure 10
Figure 10
Pathway analysis and molecular mechanisms in hypertension. The pathways have been mapped using KEGG and Wiki Pathways. Color codes are used to describe the reaction steps of the pathway model.
Figure 11
Figure 11
Toxicogenomic analysis of differentially expressed genes by the Comparative Toxicogenomics Database (CTD) helps to study the chemical genome to phenome relationships.
Figure 12
Figure 12
Based on the fold variations in gene expression and abnormal expression levels of differentially expressed genes in hypertension patients and controls.
Figure 13
Figure 13
(A–C) 2D interactions of CID:65999, CID:135409642, and CID:3749 with 4WRF. (D–F) 2D interactions of CID:2450, CID:65999, and CID:71301 with 2GFO. (G–I) 2D interactions of CID:110635, CID:135409642, and CID:3157 with 6EUB. (J–L) 2D interactions of CID:65999, CID:110635, and CID:3749 with 6DK5.
Figure 14
Figure 14
RMSD plot of 4RWF protein with three ligands, (A) CID:65999, (B) CID:135409642, and (C) CID:3749, respectively. RMSD plot of the 2GFO protein with three ligands, (D) CID:2540, (E) CID:65999, and (F) CID:71301, respectively. The x axis depicts the simulation’s time frame (in seconds). The protein RMSD variation is shown on the right y axis, while the RMSD variation of the ligand is shown on the left y axis.
Figure 15
Figure 15
RMSD plot of 6EUB protein with three ligands, (A) CID:110635, (B) CID:135409642, and (C) CID:3157, respectively. RMSD plot of the 6D5K protein with three ligands, (D) CID:65999, (E) CID:110635, and (F) CID:3749, respectively. The x axis depicts the simulation’s time frame (in seconds). The protein RMSD variation is shown on the right y axis, while the RMSD variation of the ligand is shown on the left y axis.
Figure 16
Figure 16
RMSF plot analysis of complex protein concerning ligands. (A) Plot of 4RWF–CID:65999, (B) plot of 4RWF–CID:135409642, (C) plot of 4RWF–CID:3749, (D) plot of 2GFO–CID:2540, (E) plot of 2GFO–CID:65999, (F) plot of 2GFO–CID:71301, (G) plot of 6EUB–CID:110635, (H) plot of 6EUB–CID:135409642, (I) plot of 6EUB–CID:3157, (J) plot of 6D5K–CID:65999, (K) plot of 6D5K–CID:110635, and (L) plot of 6D5K–CID:3749, respectively.
Figure 17
Figure 17
Protein interaction analysis (PIA). (A) PIA plot of 4RWF–CID:65999, (B) PIA plot of 4RWF–CID:135409642, (C) PIA plot of 4RWF–CID:3749, (D) PIA plot of 2GFO–CID:2540, (E) PIA plot of 2GFO–CID:65999, and (F) PIA plot of 2GFO–CID:71301.
Figure 18
Figure 18
Protein interaction analysis (PIA). (A) PIA plot of 6EUB–CID:110635, (B) PIA plot of 6EUB–CID:135409642, (C) PIA plot of 6EUB–CID:3157, (D) PIA plot of 6DK5–CID:65999, (E) PIA plot of 6DK5–CID:110635, and (F) PIA plot of 6DK5–CID:3749.

Similar articles

Cited by

References

    1. Bromfield S.; Muntner P. High blood pressure: the leading global burden of disease risk factor and the need for worldwide prevention programs. Curr. Hypertens. Rep. 2013, 15, 134–136. 10.1007/s11906-013-0340-9. - DOI - PMC - PubMed
    1. Ali F.; Khan A.; Muhammad S. A.; Hassan S. S. u. J. G. Quantitative Real-Time Analysis of Differentially Expressed Genes in Peripheral Blood Samples of Hypertension Patients. Genes 2022, 13, 187.10.3390/genes13020187. - DOI - PMC - PubMed
    1. Singh R.; Suh I.; Singh V.; Chaithiraphan S.; Laothavorn P.; Sy R.; Babilonia N.; Rahman A.; Sheikh S.; Tomlinson B.; Sarraf-Zadigan N. Hypertension and stroke in Asia: prevalence, control and strategies in developing countries for prevention. J. Hum. Hypertens. 2000, 14, 749–763. 10.1038/sj.jhh.1001057. - DOI - PubMed
    1. Gupta R. Hypertension in India--definition, prevalence and evaluation. J. Indian Med. Assoc. 1999, 97, 74–80. - PubMed
    1. Mills K. T.; Bundy J. D.; Kelly T. N.; Reed J. E.; Kearney P. M.; Reynolds K.; Chen J.; He J. Global disparities of hypertension prevalence and control: a systematic analysis of population-based studies from 90 countries. Circulation 2016, 134, 441–450. 10.1161/CIRCULATIONAHA.115.018912. - DOI - PMC - PubMed