

Multiple cell types in the oviduct express the prolactin receptor
- PMID: 35812077
- PMCID: PMC9254223
- DOI: 10.1096/fba.2022-00004
Multiple cell types in the oviduct express the prolactin receptor
Abstract
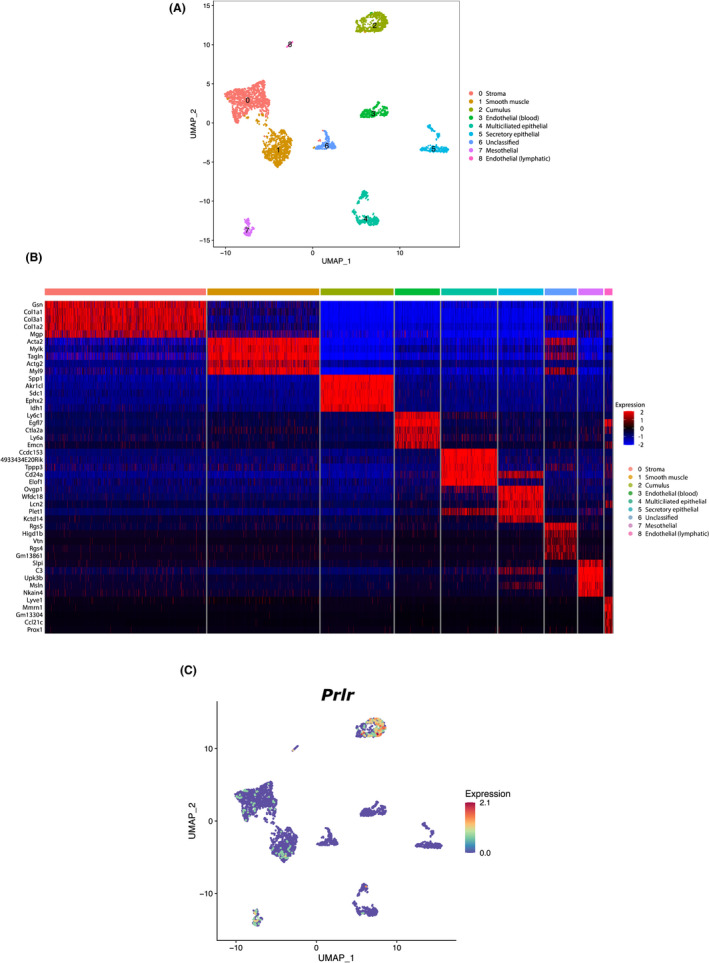
Little is known about the physiological role of prolactin in the oviduct. Examining mRNA for all four isoforms of the prolactin receptor (PRLR) in mice by functional oviduct segment and stage of the estrous cycle, we found short form 3 (SF3) to be the most highly expressed, far exceeding the long form (LF) in highly ciliated areas such as the infundibulum, whereas in areas of low ciliation, the SF3 to LF ratio was ~1. SF2 expression was low throughout the oviduct, and SF1 was undetectable. Only in the infundibulum did PRLR ratios change with the estrous cycle. Immunofluorescent localization of SF3 and LF showed an epithelial (both mucosal and mesothelial) distribution aligned with the mRNA results. Despite the high SF3/LF ratio in densely ciliated regions, these regions responded to an acute elevation of prolactin (30 min, intraperitoneal), with LF-tyrosine phosphorylated STAT5 seen within cilia. Collectively, these results show ciliated cells are responsive to prolactin and suggest that prolactin regulates estrous cyclic changes in ciliated cell function in the infundibulum. Changes in gene expression in the infundibulum after prolonged prolactin treatment (7-day) showed prolactin-induced downregulation of genes necessary for cilium development/function, a result supporting localization of PRLRs on ciliated cells, and one further suggesting hyperprolactinemia would negatively impact ciliated cell function and therefore fertility. Flow cytometry, single-cell RNAseq, and analysis of LF-td-Tomato transgenic mice supported expression of PRLRs in at least a proportion of epithelial cells while also hinting at additional roles for prolactin in smooth muscle and other stromal cells.
Keywords: cilia; estrous cycle; gene expression profiling; hyperprolactinemia; prolactin; receptors.
© 2022 The Authors. FASEB BioAdvances published by Wiley Periodicals LLC on behalf of The Federation of American Societies for Experimental Biology.
Conflict of interest statement
All authors declare that there is no conflict of interest that could be perceived as prejudicing the impartiality of the research reported.
Figures


Similar articles
-
Cellular localization and changes in expression of prolactin receptor isoforms in sheep ovary throughout the estrous cycle.Reproduction. 2004 Nov;128(5):545-53. doi: 10.1530/rep.1.00343. Reproduction. 2004. PMID: 15509700
-
Changes in aquaporin 5 in the non-ciliated cells of mouse oviduct according to sexual maturation and oestrous cycle.Reprod Fertil Dev. 2017 Feb;29(2):336-344. doi: 10.1071/RD15186. Reprod Fertil Dev. 2017. PMID: 26272113
-
Distribution of prolactin receptors suggests an intraductal role for prolactin in the mouse and human mammary gland, a finding supported by analysis of signaling in polarized monolayer cultures.Cell Tissue Res. 2011 Nov;346(2):175-89. doi: 10.1007/s00441-011-1253-z. Epub 2011 Nov 12. Cell Tissue Res. 2011. PMID: 22081226
-
[Progress in prolactin receptor research].Sheng Li Ke Xue Jin Zhan. 2012 Feb;43(1):17-23. Sheng Li Ke Xue Jin Zhan. 2012. PMID: 22582593 Review. Chinese.
-
Prolactin (PRL) and its receptor: actions, signal transduction pathways and phenotypes observed in PRL receptor knockout mice.Endocr Rev. 1998 Jun;19(3):225-68. doi: 10.1210/edrv.19.3.0334. Endocr Rev. 1998. PMID: 9626554 Review.
References
-
- Stewart CA, Behringer RR. Mouse oviduct development. In: Kubiak JZ, ed. Mouse Development: From Oocyte to Stem Cells. Springer; 2012:247‐262. - PubMed
-
- Stewart CA, Behringer RR. Mouse oviduct development. Results Probl Cell Differ. 2012;55:247‐262. - PubMed
-
- Boutin JM, Edery M, Shirota M, et al. Identification of a cDNA encoding a long form of prolactin receptor in human hepatoma and breast cancer cells. Mol Endocrinol. 1989;3:1455‐1461. - PubMed
-
- Hu ZZ, Meng JP, Dufau ML. Isolation and characterization of two novel forms of the human prolactin receptor generated by alternative splicing of a newly identified exon 11. J Biol Chem. 2001;276:41086‐41094. - PubMed
-
- Tzeng SJ, Linzer DI. Prolactin receptor expression in the developing mouse embryo. Mol Reprod Dev. 1997;48:45‐52. - PubMed
Grants and funding
LinkOut - more resources
Full Text Sources
Molecular Biology Databases
Miscellaneous