

Diagnostic Accuracy of the Diffusion-Weighted Imaging Method Used in Association With the Apparent Diffusion Coefficient for Differentiating Between Primary Central Nervous System Lymphoma and High-Grade Glioma: Systematic Review and Meta-Analysis
- PMID: 35812103
- PMCID: PMC9263097
- DOI: 10.3389/fneur.2022.882334
Diagnostic Accuracy of the Diffusion-Weighted Imaging Method Used in Association With the Apparent Diffusion Coefficient for Differentiating Between Primary Central Nervous System Lymphoma and High-Grade Glioma: Systematic Review and Meta-Analysis
Abstract
Background: It is difficult to differentiate between a few primary central nervous system lymphoma (PCNSL) and high-grade glioma (HGG) using conventional magnetic resonance imaging techniques. The purpose of this study is to explore whether diffusion-weighted imaging (DWI) can be effectively used to differentiate between these two types of tumors by analyzing the apparent diffusion coefficient (ADC).
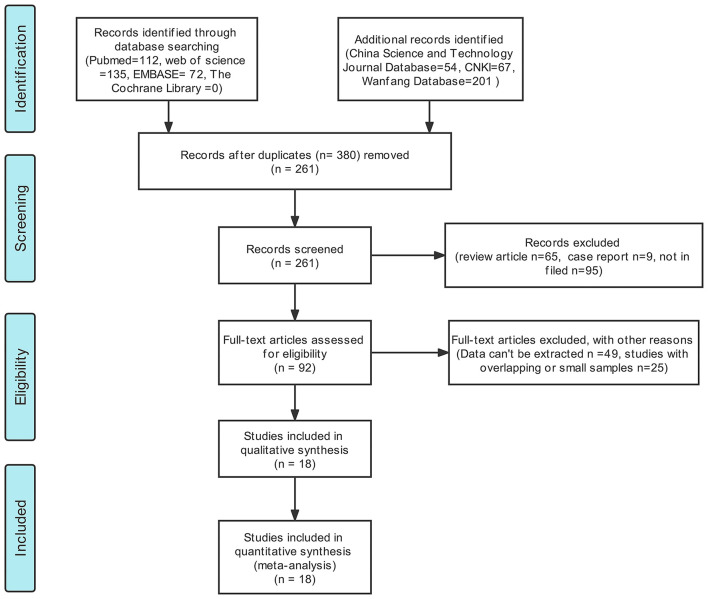
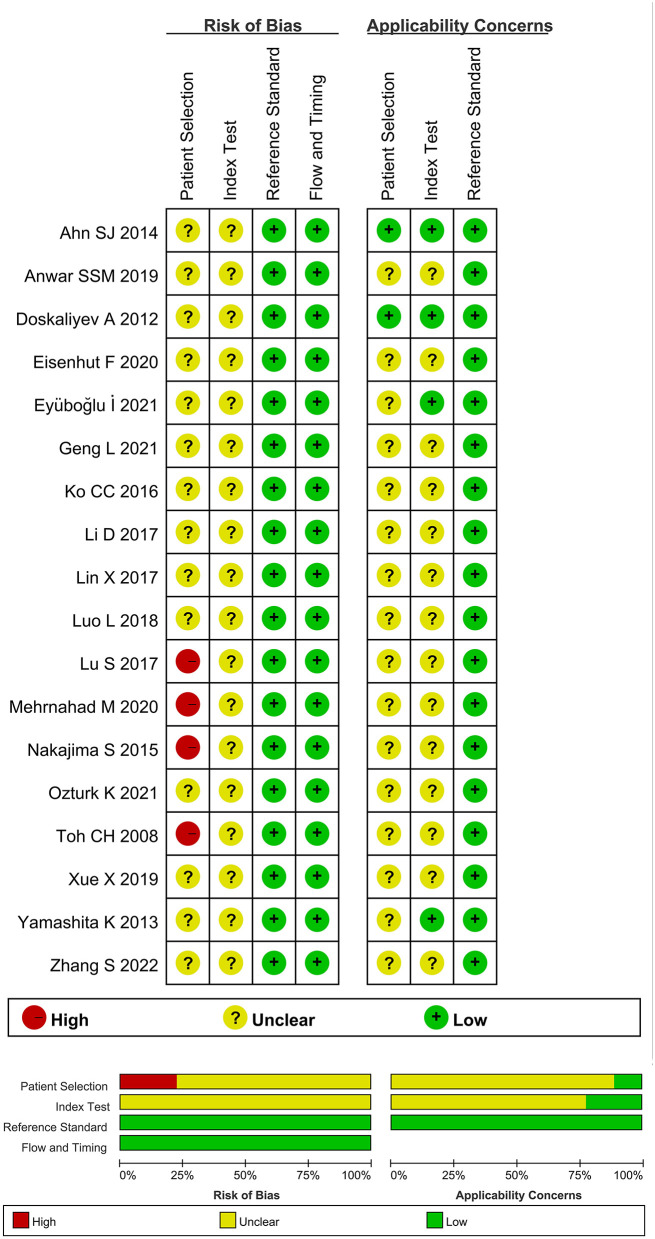
Research design and methods: Data presented in Pubmed, Embase, Web of Science, Cochrane Library, China National Knowledge Infrastructure (CNKI), Wanfang Database, and China Science and Technology Journal Database (CQVIP) were analyzed. High-quality literature was included, and the quality was evaluated using the quality assessment of diagnostic accuracy studies-2 (QUADAS-2) tool, and the studies were based on the inclusion and exclusion rules. The pooled sensitivity, pooled specificity, pooled positive likelihood ratio (PLR), pooled negative likelihood ratio (NLR), pooled diagnostic odds ratio (DOR), area under the curve (AUC) of the summary operating characteristic curve (SROC), and corresponding 95% confidence interval (CI) were calculated using the bivariate mixed effect model. Meta-regression analysis and subgroup analysis were used to explore the sources of heterogeneity. The publication bias was evaluated by conducting Deek's test.
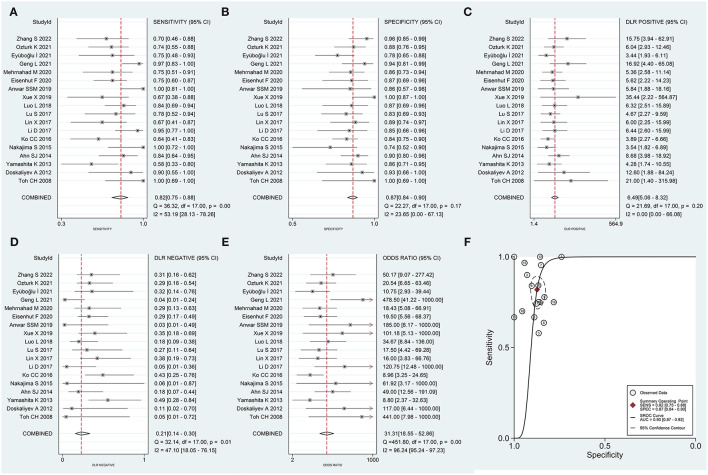
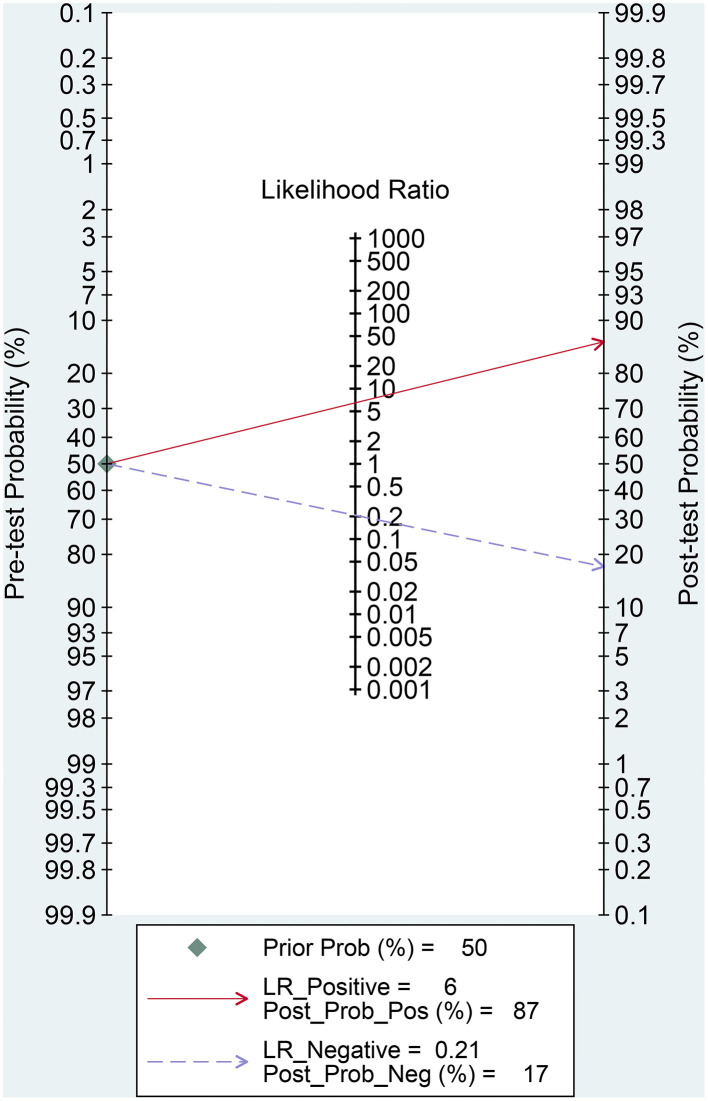
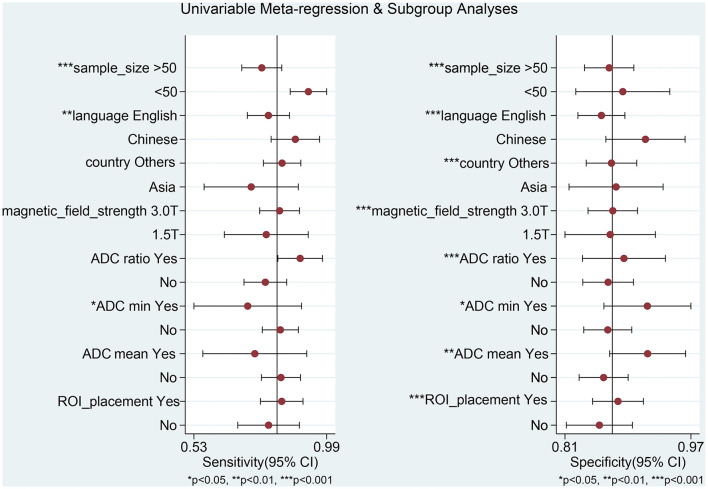
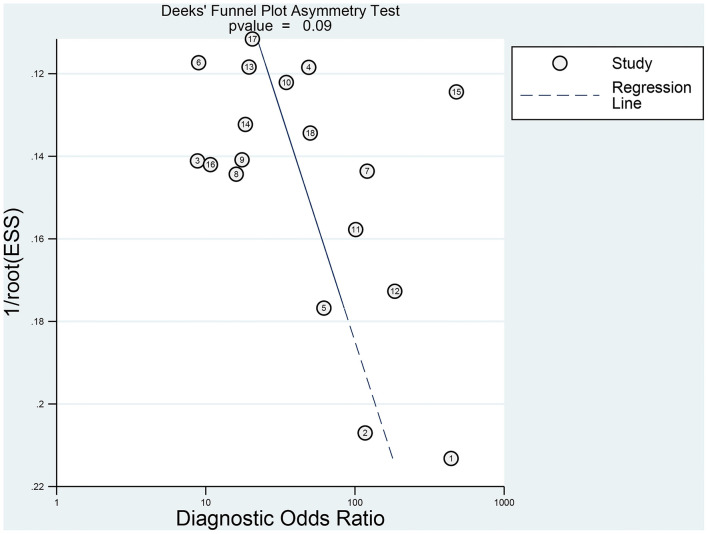
Results: In total, eighteen high-quality studies were included. The pooled sensitivity was 0.82 (95% CI: 0.75-0.88), the pooled specificity was 0.87 (95% CI: 0.84-0.90), the pooled positive likelihood ratio was 6.49 (95% CI: 5.06-8.32), the pooled NLR was 0.21 (95% CI: 0.14-0.30), the pooled DOR was 31.31 (95% CI: 18.55-52.86), and the pooled AUC was 0.90 (95% CI: 0.87-0.92). Sample size, language and country of publication, magnetic field strength, region of interest (ROI), and cut-off values of different types of ADC can potentially be the sources of heterogeneity. There was no publication bias in this meta-analysis.
Conclusions: The results obtained from the meta-analysis suggest that DWI is characterized by high diagnostic accuracy and thus can be effectively used for differentiating between PCNSL and HGG.
Keywords: diagnosis; diffusion-weighted imaging; high-grade glioma; lymphoma; meta-analysis.
Copyright © 2022 Du, He and Lin.
Conflict of interest statement
The authors declare that the research was conducted in the absence of any commercial or financial relationships that could be construed as a potential conflict of interest.
Figures
Similar articles
-
Use of 18F-FDG-PET/CT in differential diagnosis of primary central nervous system lymphoma and high-grade gliomas: A meta-analysis.Front Neurol. 2022 Aug 17;13:935459. doi: 10.3389/fneur.2022.935459. eCollection 2022. Front Neurol. 2022. PMID: 36061992 Free PMC article.
-
Diagnostic performance of DWI for differentiating primary central nervous system lymphoma from glioblastoma: a systematic review and meta-analysis.Neurol Sci. 2019 May;40(5):947-956. doi: 10.1007/s10072-019-03732-7. Epub 2019 Jan 31. Neurol Sci. 2019. PMID: 30706241
-
Accuracy of ADC derived from DWI for differentiating high-grade from low-grade gliomas: Systematic review and meta-analysis.Medicine (Baltimore). 2020 Feb;99(8):e19254. doi: 10.1097/MD.0000000000019254. Medicine (Baltimore). 2020. PMID: 32080132 Free PMC article.
-
Diagnostic accuracy of arterial spin labeling in differentiating between primary central nervous system lymphoma and high-grade glioma: a systematic review and meta-analysis.Expert Rev Anticancer Ther. 2022 Jul;22(7):763-771. doi: 10.1080/14737140.2022.2082948. Epub 2022 May 31. Expert Rev Anticancer Ther. 2022. PMID: 35612545
-
Diagnostic accuracy of diffusion-weighted imaging in differentiating glioma recurrence from posttreatment-related changes: a meta-analysis.Expert Rev Anticancer Ther. 2022 Jan;22(1):123-130. doi: 10.1080/14737140.2022.2000396. Epub 2021 Nov 10. Expert Rev Anticancer Ther. 2022. PMID: 34727815
Cited by
-
Imaging Role in Diagnosis, Prognosis, and Treatment Response Prediction Associated with High-grade Glioma.J Med Signals Sens. 2024 Mar 27;14:7. doi: 10.4103/jmss.jmss_30_22. eCollection 2024. J Med Signals Sens. 2024. PMID: 38993200 Free PMC article. Review.
-
Distinctive magnetic resonance imaging features in primary central nervous system lymphoma: A case report.World J Radiol. 2023 Sep 28;15(9):274-280. doi: 10.4329/wjr.v15.i9.274. World J Radiol. 2023. PMID: 37823021 Free PMC article.
-
Use of 18F-FDG-PET/CT in differential diagnosis of primary central nervous system lymphoma and high-grade gliomas: A meta-analysis.Front Neurol. 2022 Aug 17;13:935459. doi: 10.3389/fneur.2022.935459. eCollection 2022. Front Neurol. 2022. PMID: 36061992 Free PMC article.
-
Radiomics for differentiation of gliomas from primary central nervous system lymphomas: a systematic review and meta-analysis.Front Oncol. 2024 Feb 14;14:1291861. doi: 10.3389/fonc.2024.1291861. eCollection 2024. Front Oncol. 2024. PMID: 38420015 Free PMC article.
-
The Prognostic Value of Preoperative Inflammatory Markers for Pathological Grading of Glioma Patients.Technol Cancer Res Treat. 2024 Jan-Dec;23:15330338241273160. doi: 10.1177/15330338241273160. Technol Cancer Res Treat. 2024. PMID: 39099463 Free PMC article.
References
Publication types
LinkOut - more resources
Full Text Sources