Identification of Hub Genes and Immune-Related Pathways for Membranous Nephropathy by Bioinformatics Analysis
- PMID: 35812314
- PMCID: PMC9263269
- DOI: 10.3389/fphys.2022.914382
Identification of Hub Genes and Immune-Related Pathways for Membranous Nephropathy by Bioinformatics Analysis
Abstract
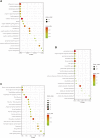
OBJECTIVE: We aim to explore the detailed molecular mechanisms of membrane nephropathy (MN) related genes by bioinformatics analysis. METHODS: Two microarray datasets (GSE108109 and GSE104948) with glomerular gene expression data from 65 MN patients and 9 healthy donors were obtained from the Gene Expression Omnibus (GEO) database. After processing the raw data, DEGs screening was conducted using the LIMMA (linear model for microarray data) package and Gene set enrichment analysis (GSEA) was performed with GSEA software (v. 3.0), followed by gene ontology (GO) enrichment and Kyoto Encyclopedia of Genes and Genomes (KEGG) pathway enrichment. The protein-protein interaction (PPI) network analysis was carried out to determine the hub genes, by applying the maximal clique centrality (MCC) method, which was visualized by Cytoscape. Finally, utilizing the Nephroseq v5 online platform, we analyzed subgroups associated with hub genes. The findings were further validated by immunohistochemistry (IHC) staining in renal tissues from MN or control patients. RESULTS: A sum of 370 DEGs (188 up-regulated genes, 182 down-regulated genes) and 20 hub genes were ascertained. GO and KEGG enrichment analysis demonstrated that DEGs of MN were preponderantly associated with cell damage and complement cascade-related immune responses. Combined with literature data and hub gene-related MN subset analysis, CTSS, ITGB2, and HCK may play important roles in the pathological process of MN. CONCLUSION: This study identified novel hub genes in MN using bioinformatics. We found that some hub genes such as CTSS, ITGB2, and HCK might contribute to MN immunopathological process, providing new insights for further study of the molecular mechanisms underlying glomerular injury of MN.
Keywords: GSEA; bioinformatics analysis; hub genes; immunology; membranous nephropathy.
Copyright © 2022 Cai, Wang, Ge and Xu.
Conflict of interest statement
The authors declare that the research was conducted in the absence of any commercial or financial relationships that could be construed as a potential conflict of interest.
Figures


Similar articles
-
Bioinformatic Analysis Reveals Novel Immune-Associated Hub Genes in Human Membranous Nephropathy.Genet Test Mol Biomarkers. 2019 Jan;23(1):23-31. doi: 10.1089/gtmb.2018.0137. Epub 2018 Dec 8. Genet Test Mol Biomarkers. 2019. PMID: 30526079
-
Investigation of the Mechanism of Complement System in Diabetic Nephropathy via Bioinformatics Analysis.J Diabetes Res. 2021 May 24;2021:5546199. doi: 10.1155/2021/5546199. eCollection 2021. J Diabetes Res. 2021. PMID: 34124269 Free PMC article.
-
Identification of molecular mechanism and key biomarkers in membranous nephropathy by bioinformatics analysis.Am J Transl Res. 2022 Aug 15;14(8):5833-5847. eCollection 2022. Am J Transl Res. 2022. PMID: 36105034 Free PMC article.
-
Identifying C1QB, ITGAM, and ITGB2 as potential diagnostic candidate genes for diabetic nephropathy using bioinformatics analysis.PeerJ. 2023 May 25;11:e15437. doi: 10.7717/peerj.15437. eCollection 2023. PeerJ. 2023. PMID: 37250717 Free PMC article.
-
Identification of hub genes and their correlation with immune infiltrating cells in membranous nephropathy: an integrated bioinformatics analysis.Eur J Med Res. 2023 Nov 16;28(1):525. doi: 10.1186/s40001-023-01311-3. Eur J Med Res. 2023. PMID: 37974210 Free PMC article.
Cited by
-
The role of the complement system in primary membranous nephropathy: A narrative review in the era of new therapeutic targets.Front Immunol. 2022 Oct 24;13:1009864. doi: 10.3389/fimmu.2022.1009864. eCollection 2022. Front Immunol. 2022. PMID: 36353636 Free PMC article. Review.
-
Single-Cell RNA Sequencing Reveals RAC1 Involvement in Macrophages Efferocytosis in Diabetic Kidney Disease.Inflammation. 2024 Apr;47(2):753-770. doi: 10.1007/s10753-023-01942-y. Epub 2023 Dec 8. Inflammation. 2024. PMID: 38064011
-
Identification and validation of biomarkers in membranous nephropathy and pan-cancer analysis.Front Immunol. 2024 May 23;15:1302909. doi: 10.3389/fimmu.2024.1302909. eCollection 2024. Front Immunol. 2024. PMID: 38846934 Free PMC article.
-
Analysis of complement system and its related factors in Alzheimer's disease.BMC Neurol. 2023 Dec 19;23(1):446. doi: 10.1186/s12883-023-03503-0. BMC Neurol. 2023. PMID: 38114984 Free PMC article.
-
Shared hub genes in membranous nephropathy and kidney renal clear cell carcinoma: investigating molecular overlap and tumor progression.Discov Oncol. 2025 Jun 9;16(1):1035. doi: 10.1007/s12672-025-02701-1. Discov Oncol. 2025. PMID: 40489038 Free PMC article.
References
-
- Bandettini W. P., Kellman P., Mancini C., Booker O. J., Vasu S., Leung S. W., et al. (2012). MultiContrast Delayed Enhancement (MCODE) Improves Detection of Subendocardial Myocardial Infarction by Late Gadolinium Enhancement Cardiovascular Magnetic Resonance: a Clinical Validation Study. J. Cardiovasc Magn. Reson 14, 83. 10.1186/1532-429x-14-83 - DOI - PMC - PubMed
LinkOut - more resources
Full Text Sources
Miscellaneous

