

ESRRG, ATP4A, and ATP4B as Diagnostic Biomarkers for Gastric Cancer: A Bioinformatic Analysis Based on Machine Learning
- PMID: 35812327
- PMCID: PMC9262247
- DOI: 10.3389/fphys.2022.905523
ESRRG, ATP4A, and ATP4B as Diagnostic Biomarkers for Gastric Cancer: A Bioinformatic Analysis Based on Machine Learning
Abstract
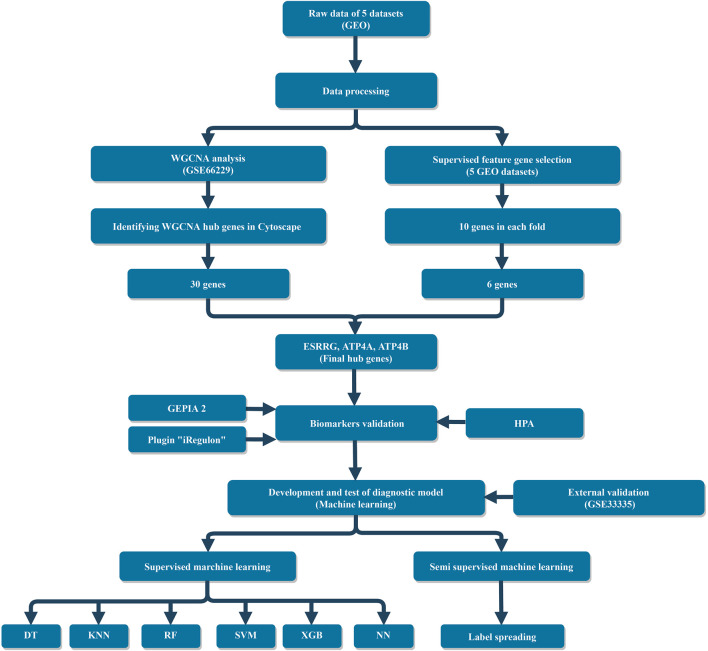
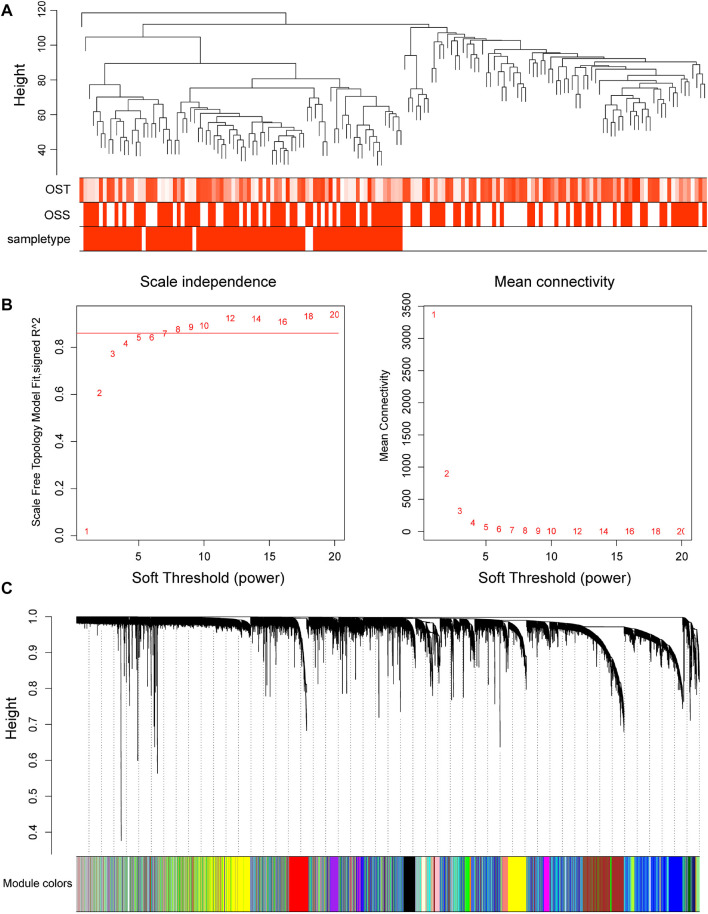
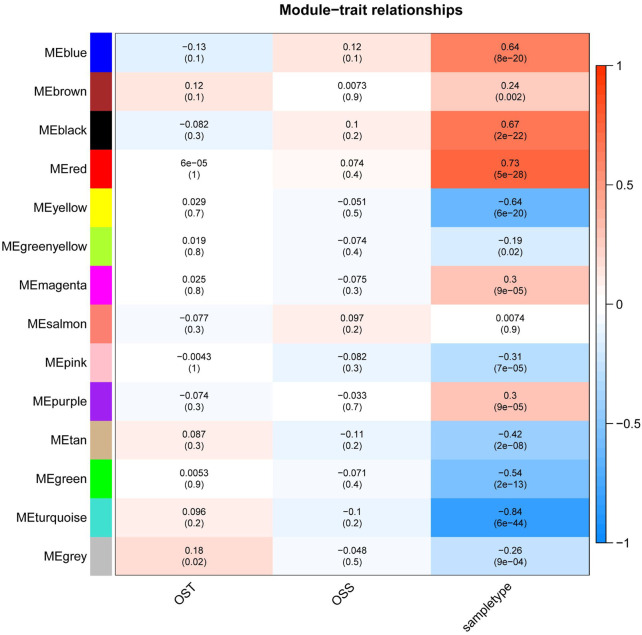
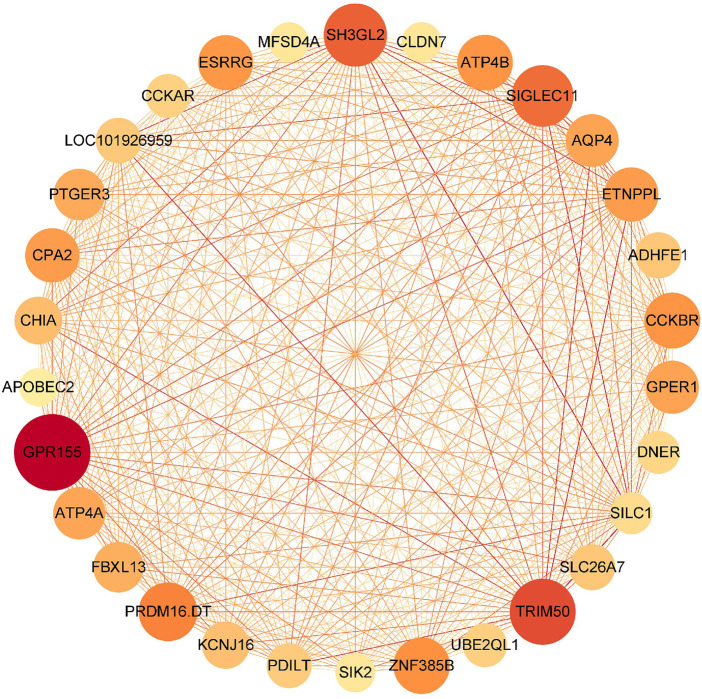
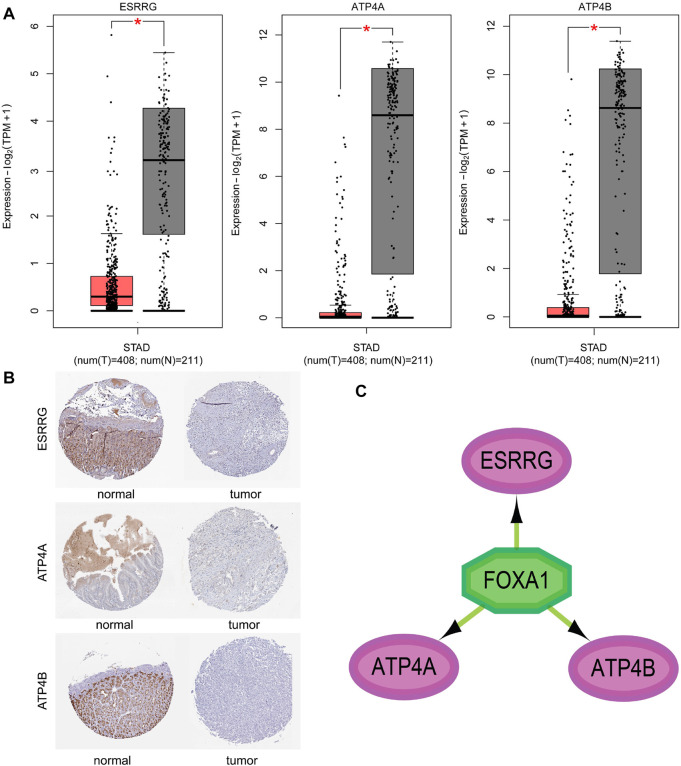
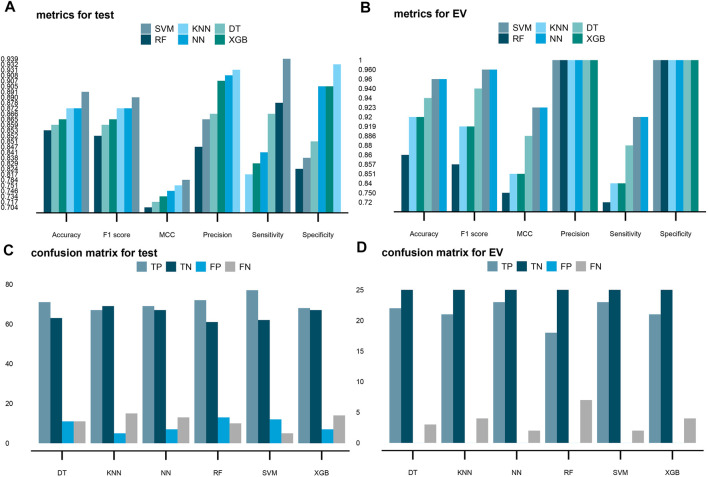
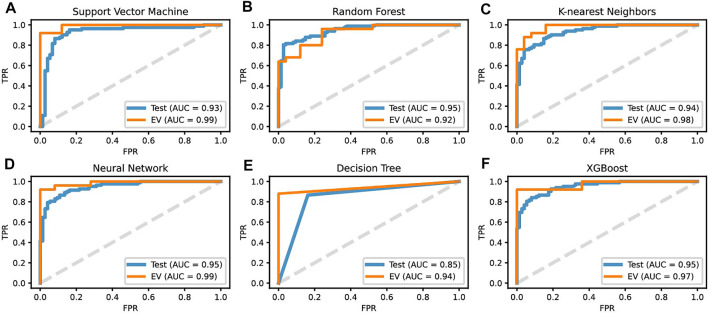
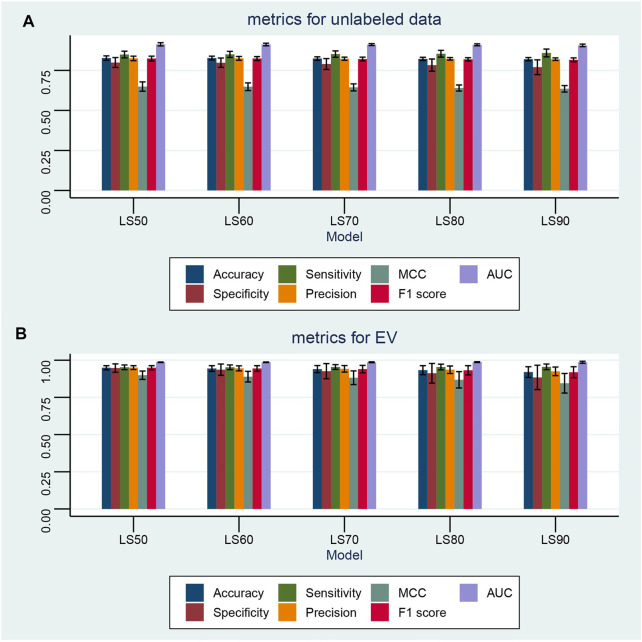
Based on multiple bioinformatics methods and machine learning techniques, this study was designed to explore potential hub genes of gastric cancer with a diagnostic value. The novel biomarkers were detected through multiple databases of gastric cancer-related genes. The NCBI Gene Expression Omnibus (GEO) database was used to obtain gene expression files. Three hub genes (ESRRG, ATP4A, and ATP4B) were detected through a combination of weighted gene co-expression network analysis (WGCNA), gene-gene interaction network analysis, and supervised feature selection method. GEPIA2 was used to verify the differences in the expression levels of the hub genes in normal and cancer tissues in the RNA-seq levels of Genotype-Tissue Expression (GTEx) and The Cancer Genome Atlas (TCGA) databases. The objectivity of potential hub genes was also verified by immunohistochemistry in the Human Protein Atlas (HPA) database and transcription factor-hub gene regulatory network. Machine learning (ML) methods including data pre-processing, model selection and cross-validation, and performance evaluation were examined on the hub-gene expression profiles in five Gene Expression Omnibus datasets and verified on a GEO external validation (EV) dataset. Six supervised learning models (support vector machine, random forest, k-nearest neighbors, neural network, decision tree, and eXtreme Gradient Boosting) and one semi-supervised learning model (label spreading) were established to evaluate the diagnostic value of biomarkers. Among the six supervised models, the support vector machine (SVM) algorithm was the most effective one according to calculated performance metrics, including 0.93 and 0.99 area under the curve (AUC) scores on the test and external validation datasets, respectively. Furthermore, the semi-supervised model could also successfully learn and predict sample types, achieving a 0.986 AUC score on the EV dataset, even when 10% samples in the five GEO datasets were labeled. In conclusion, three hub genes (ATP4A, ATP4B, and ESRRG) closely related to gastric cancer were mined, based on which the ML diagnostic model of gastric cancer was conducted.
Keywords: WGCNA; bioinformatics; diagnostic model; gastric cancer; machine learning.
Copyright © 2022 Chen, Wang, Liu and Xi.
Conflict of interest statement
The authors declare that the research was conducted in the absence of any commercial or financial relationships that could be construed as a potential conflict of interest.
Figures
Similar articles
-
Identification of immune- and autophagy-related genes and effective diagnostic biomarkers in endometriosis: a bioinformatics analysis.Ann Transl Med. 2022 Dec;10(24):1397. doi: 10.21037/atm-22-5979. Ann Transl Med. 2022. PMID: 36660690 Free PMC article.
-
Identification of the hub genes in gastric cancer through weighted gene co-expression network analysis.PeerJ. 2021 Mar 5;9:e10682. doi: 10.7717/peerj.10682. eCollection 2021. PeerJ. 2021. PMID: 33717664 Free PMC article.
-
Identification of potential biomarkers with colorectal cancer based on bioinformatics analysis and machine learning.Math Biosci Eng. 2021 Oct 19;18(6):8997-9015. doi: 10.3934/mbe.2021443. Math Biosci Eng. 2021. PMID: 34814332
-
Machine learning and deep learning methods that use omics data for metastasis prediction.Comput Struct Biotechnol J. 2021 Sep 4;19:5008-5018. doi: 10.1016/j.csbj.2021.09.001. eCollection 2021. Comput Struct Biotechnol J. 2021. PMID: 34589181 Free PMC article. Review.
-
Machine learning applications in cancer prognosis and prediction.Comput Struct Biotechnol J. 2014 Nov 15;13:8-17. doi: 10.1016/j.csbj.2014.11.005. eCollection 2015. Comput Struct Biotechnol J. 2014. PMID: 25750696 Free PMC article. Review.
Cited by
-
Identification of gastric cancer biomarkers through in-silico analysis of microarray based datasets.Biochem Biophys Rep. 2024 Nov 24;40:101880. doi: 10.1016/j.bbrep.2024.101880. eCollection 2024 Dec. Biochem Biophys Rep. 2024. PMID: 39655267 Free PMC article.
-
HCMV detection in Asian gastric cancer RNA-seq data sets and clinical validation in Indian GC patients reveals the HCMV-GC specific gene signatures.mSystems. 2024 Oct 22;9(10):e0067324. doi: 10.1128/msystems.00673-24. Epub 2024 Sep 16. mSystems. 2024. PMID: 39283078 Free PMC article.
-
Big Data and Artificial Intelligence in Drug Discovery for Gastric Cancer: Current Applications and Future Perspectives.Curr Med Chem. 2025;32(10):1968-1986. doi: 10.2174/0929867331666230913105829. Curr Med Chem. 2025. PMID: 37711014 Review.
-
Beyond Biomarkers: Machine Learning-Driven Multiomics for Personalized Medicine in Gastric Cancer.J Pers Med. 2025 Apr 24;15(5):166. doi: 10.3390/jpm15050166. J Pers Med. 2025. PMID: 40423038 Free PMC article. Review.
-
DNMT1 blocks SOX21-repressed CKS2 transcription to promote gastric cancer progression.BMC Cancer. 2025 Jul 17;25(1):1182. doi: 10.1186/s12885-025-14577-z. BMC Cancer. 2025. PMID: 40676553 Free PMC article.
References
LinkOut - more resources
Full Text Sources