. 2022 Jun 23:13:918928.
doi: 10.3389/fimmu.2022.918928. eCollection 2022.

Peptidome Surveillance Across Evolving SARS-CoV-2 Lineages Reveals HLA Binding Conservation in Nucleocapsid Among Variants With Most Potential for T-Cell Epitope Loss in Spike

Affiliations

Peptidome Surveillance Across Evolving SARS-CoV-2 Lineages Reveals HLA Binding Conservation in Nucleocapsid Among Variants With Most Potential for T-Cell Epitope Loss in Spike

Kamil Wnuk et al. Front Immunol. .

Abstract

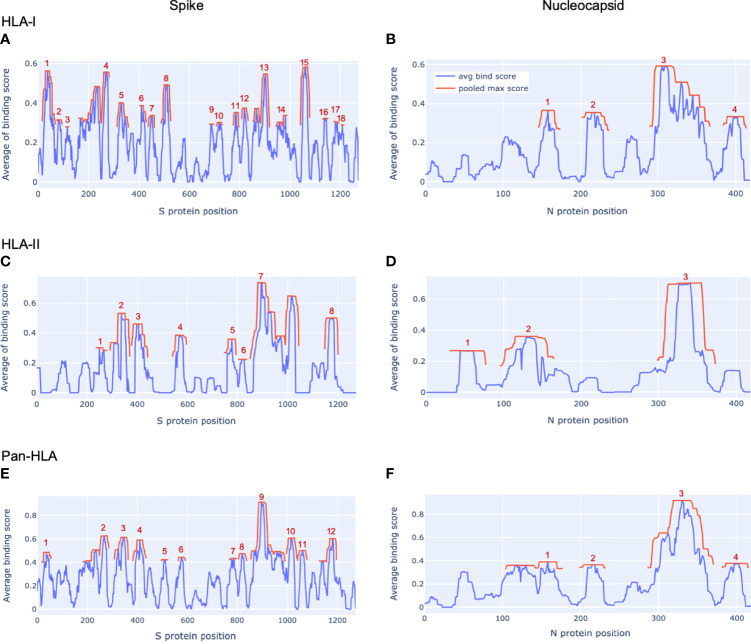
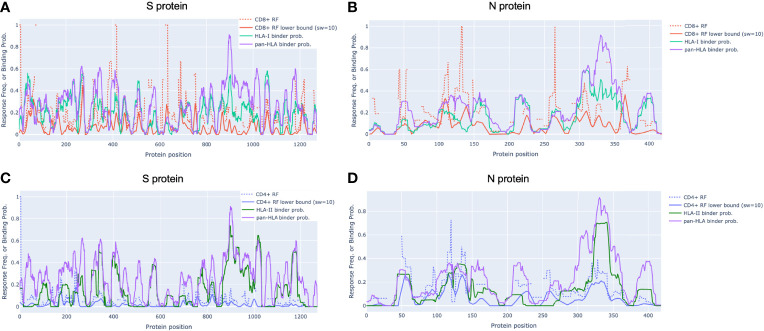
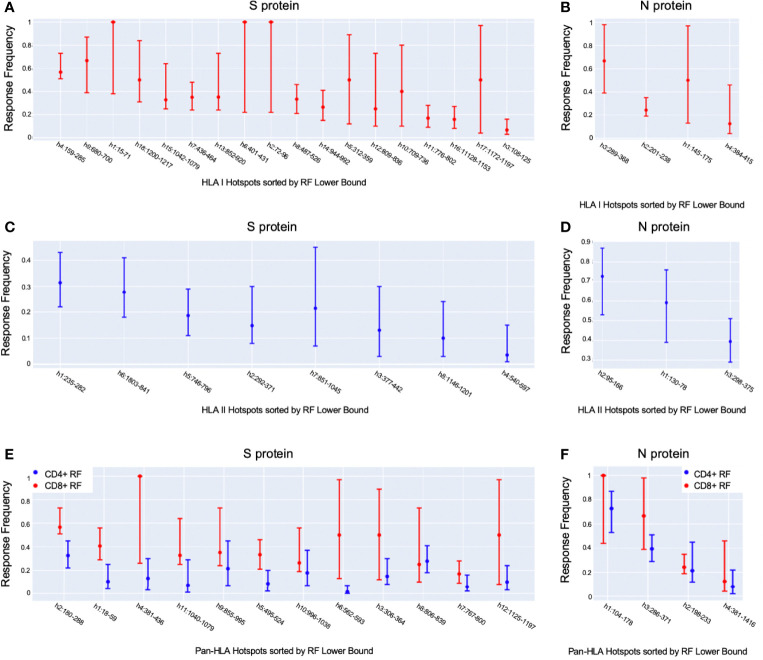
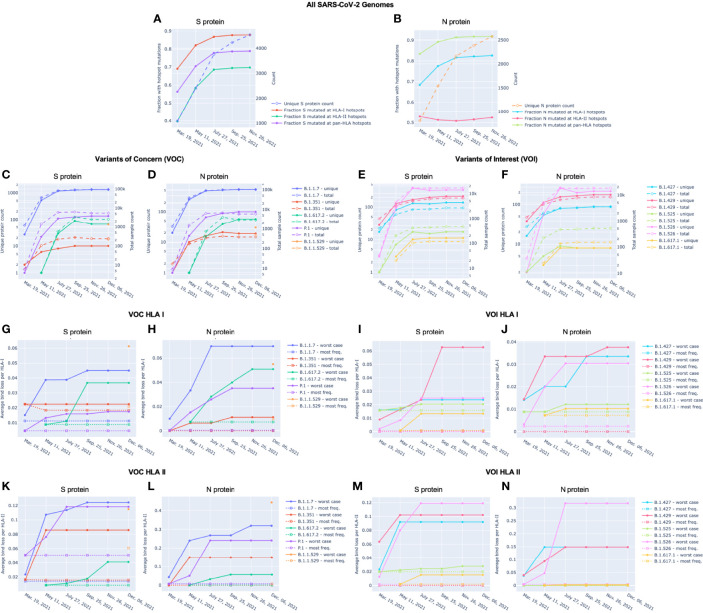
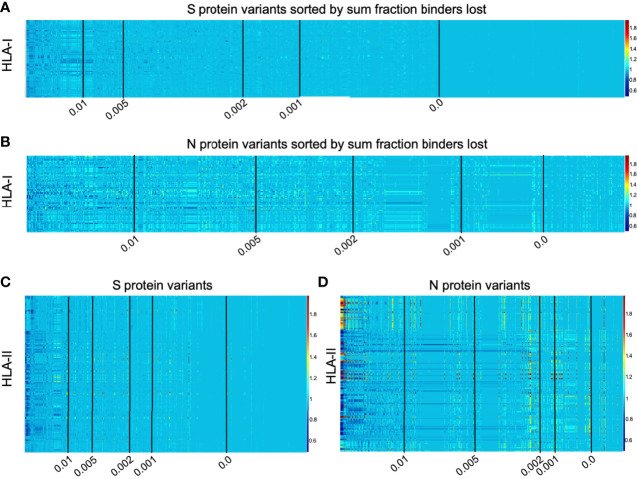
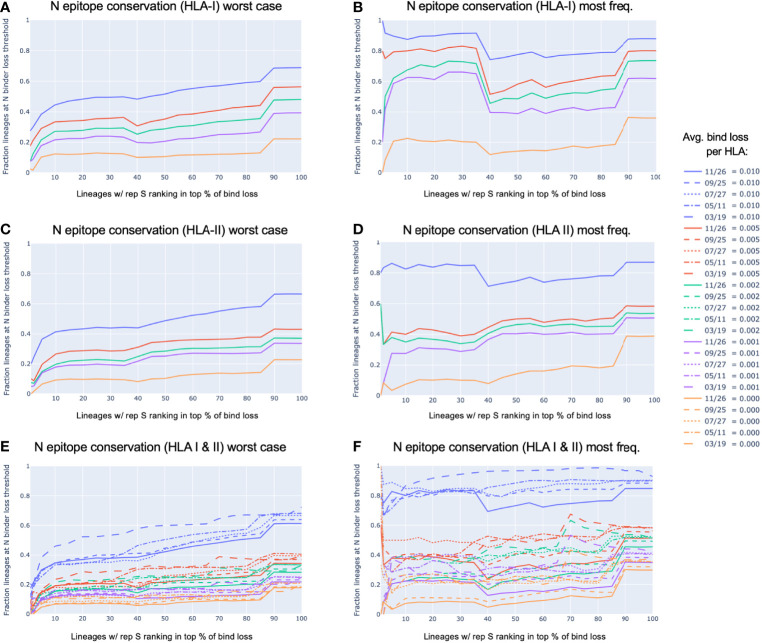
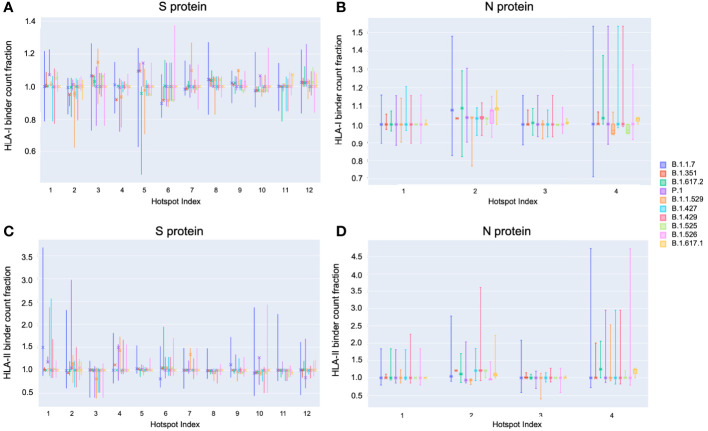
To provide a unique global view of the relative potential for evasion of CD8+ and CD4+ T cells by SARS-CoV-2 lineages as they evolve over time, we performed a comprehensive analysis of predicted HLA-I and HLA-II binding peptides in Spike (S) and Nucleocapsid (N) protein sequences of all available SARS-CoV-2 genomes as provided by NIH NCBI at a bi-monthly interval between March and December of 2021. A data supplement of all B.1.1.529 (Omicron) genomes from GISAID in early December was also used to capture the rapidly spreading variant. A key finding is that throughout continued viral evolution and increasing rates of mutations occurring at T-cell epitope hotspots, protein instances with worst-case binding loss did not become the most frequent for any Variant of Concern (VOC) or Variant of Interest (VOI) lineage; suggesting T-cell evasion is not likely to be a dominant evolutionary pressure on SARS-CoV-2. We also determined that throughout the course of the pandemic in 2021, there remained a relatively steady ratio of viral variants that exhibit conservation of epitopes in the N protein, despite significant potential for epitope loss in S relative to other lineages. We further localized conserved regions in N with high epitope yield potential, and illustrated heterogeneity in HLA-I binding across the S protein consistent with empirical observations. Although Omicron's high volume of mutations caused it to exhibit more epitope loss potential than most frequently observed versions of proteins in almost all other VOCs, epitope candidates across its most frequent N proteins were still largely conserved. This analysis adds to the body of evidence suggesting that N may have merit as an additional antigen to elicit immune responses to vaccination with increased potential to provide sustained protection against COVID-19 disease in the face of emerging variants.

Keywords: HLA; SARS-CoV-2; binding; conservation; epitope; nucleocapsid; spike; variants.


Conflict of interest statement

All authors are affiliated with Immunitybio, Inc. a company that is developing SARS-CoV-2 vaccines. The study received funding from ImmunityBio, Inc. The funder designed study, performed all analyses and wrote the submitted manuscript. Proprietary software used for HLA binding predictions will be made commercially available to interested researchers and is covered by the following intellectual property: International Application Number PCT/US2019/046582 (International Publication Number WO 2020/046587 Α2); USPTO Application 17670385.

Figures

Figure 1
Figure 1
Epitope hotspots in SARS-CoV-2 proteins. Protein regions with peak frequency of predicted binding peptides (potential epitope hotspots) across HLAs are indicated in red for our key proteins of interest from the SARS-CoV-2 reference genome (NCBI Reference Sequence: NC_045512): Spike (A, C, E) and Nucleocapsid (B, D, F). Red lines (pooled max score) show the value of the nearest maxima of the aggregate signal (avg bind score in blue) within a set sliding window size (9 amino acids for HLA-I, 15 for HLA-II, 12 for pan-HLA). For each protein we show hotspots on aggregate signals across all HLA-I molecules only (A, B), HLA-II only (C, D), as well as the combined pan-HLA signal (E, F). The legend in panel (B) applies to all panels. Aggregate signals (avg bind score in the legend) are obtained by a filtered averaging of predicted binding values across our representative HLA set. See Methods for details.
Figure 2
Figure 2
Epitope response frequency correlates with aggregated binding predictions in SARS-CoV-2 proteins. For CD8+ T-cell epitopes collected from across 25 studies by Grifoni et al. [9] we found position-specific response frequency (RF) (dash red) and RF lower bound (95% confidence interval) averaged with a 10 amino acid sliding window (solid red) correlated with our aggregated HLA-I (turquoise) and pan-HLA (purple) binding prediction scores in the S (A) and N (B) proteins. CD4+ T-cell epitope RF (dash blue) and RF lower bound (solid blue) also correlated with HLA-II (green) and pan-HLA aggregated predictions for S (C) and N (D). Legend in (A) applies to (B) legend in (C) applies to (D).
Figure 3
Figure 3
Observation-driven prioritization of epitope hotspots. Shown are our potential epitope hotspots based on binding predictions aggregated across HLAs and peptide lengths, sorted according to the maximum position-specific response frequency (RF) lower bound [9] within their ranges. We ranked HLA-I hotspots according to CD8+ RF (A, B), HLA-II hotspots according to CD4+ RF (C, D), and pan-HLA hotspots according to CD8+ RF (E, F), for S and N, respectively, for each. Each plot illustrates the maximum RF within hotspot ranges, as well as the max of both the 95% confidence interval upper and lower bounds.
Figure 4
Figure 4
Unique protein count and fraction of unique proteins with hotspot mutations over time for Spike (S) and Nucleocapsid (N) proteins. For (A) S and (B) N proteins, the unique protein count (right y-axis) and fraction of unique proteins with mutations at HLA-I, HLA-II, and pan-HLA hotspots (left y-axis) are shown. Unique protein counts included all versions of a viral protein whose amino acid sequence appeared at least 3 times in the viral genomes available through NIH NCBI at bi-monthly time points throughout 2021. Every unique protein that included at least one mutation relative to the SARS-CoV-2 reference genome occurring within an HLA binding hotspot was counted in the fraction of unique proteins with hotspot mutations. For (C–F), total sample count (right y-axis) and the number of unique versions (left y-axis) of S (C, E) and N (D, F) proteins classified as VOC (C, D) or VOI (E, F) are shown at each data sample time. December 6 included November 26 data plus supplementary genomes from GISAID to capture the emergence of B.1.1.529 (WHO: Omicron). Average bind loss per HLA-I (G-J) and HLA-II (K-N) were tracked over time where lineages were represented by their worst-case bind loss (solid lines) or most frequently occurring versions of S and N (dashed lines). VOC lineages: B.1.1.7 (Alpha), B.1.351 (Beta), B.1.617.2 (Delta), P.1 (Gamma), and B.1.1.529 (Omicron); VOI lineages: B.1.427 and B.1.429 (Epsilon), B.1.525 (Eta), B.1.526 (Iota), and B.1.617.1 (Kappa).
Figure 5
Figure 5
Illustration of per-HLA aggregate binder count fraction at pan-HLA hotspots illustrated for all HLAs across all unique versions of S and N. All plots were sorted according to sum fraction of binders lost, such that proteins with the most loss appear on the left. Each plot has 5 vertical black lines indicating average bind loss per HLA thresholds at 0.01, 0.005, 0.002, 0.001, and 0. For compactness, binder count fractions in data only from March 13, 2021 are shown here: HLA-I binder count fractions for all unique versions of (A) S and (B) N; and HLA-II binder count fractions for (C) S and (D) N variants. Interactive plots from all data sample times are available online.
Figure 6
Figure 6
N epitope conservation in SARS-CoV-2 lineages with representative S protein ranking in the top percent potential epitope loss. All viral lineages within the data were represented either by the S and N protein exhibiting the worst-case epitope loss potential (A, C, E), or by the most frequently occurring versions of S and N (B, D, F). For lineages with the S protein ranking in the top percent for the most significant loss in HLA-I or HLA-II binders (x-axis), shown are the fractions of those top loss lineages that exhibited (A, B) HLA-I binder conservation in the N protein, (C, D) HLA-II binder conservation in the N protein, or (E, F) both HLA-I and HLA-II binder conservation in the N protein; all at various conservation thresholds of average (avg.) bind loss per HLA, as represented by the colors shown in the legend. The strictest N conservation criteria was used to illustrate the dynamics of the relationship throughout the span of the 2021 (E, F).
Figure 7
Figure 7
Distribution of binder count fraction relative to reference SARS-CoV-2 at pan-HLA hotspots for VOC and VOI lineages. The box plots illustrate the distribution of HLA-I (A, B) and HLA-II (C, D) binder count fraction averaged across HLAs (y-axis) at S (A, C) and N (B, D) pan-HLA hotspots (x-axis) for all unique proteins classified as VOC and VOI lineages. Binder count fractions specific to the most frequent protein versions of each lineage are annotated with an ‘X’ on top of the box plots. VOC and VOI lineage labels are indicated in the legend at right.
Figure 8
Figure 8
Change in HLA-I binder count from SARS-CoV-2 reference at pan-HLA epitope hotspots for most frequent S and N proteins of VOC lineages. Change in potential epitope count as a fraction of reference count is shown for all HLA-I in our analysis set (y-axis) for the most frequent versions of S (A–F) and N (G-L) in each of the VOC lineages: (A, G) B.1.1.7 (Alpha), (B, H) B.1.351 (Beta), (C, I) B.1.617.2 (Delta), (D, J) P.1 (Gamma), (E, K) B.1.1.529 (Omicron), as well as the second most frequent versions of Omicron proteins (F, L). For both S and N proteins pan-HLA hotspots (x-axis) were used. Interactive versions of all plots above are available online.
Figure 9
Figure 9
Method for detection of binder hotspots. (A) Binding prediction scores of all overlapping peptides at each position along the S protein (x-axis), averaged independently for each HLA-I molecule (y-axis). (B) Top binding score locations based on thresholding max pooled averaged prediction scores independently for each HLA (per-HLA hotspots). Unselected regions are masked out and appear in gray. Values before pooling are shown to keep relation to the prior plot clear. (C) Averaged scores of all peptides classified as binders that overlap per-HLA hotspots. Color bars in (A–C) indicate scale of averaged binding prediction values for each sub-plot. See Methods for details. (D) The final HLA-I hotspot locations (red) selected by max pooling and thresholding the masked binder signal averaged across HLAs (blue).

Similar articles

Cited by

References

    1. Prévost J, Finzi A. The Great Escape? SARS-CoV-2 Variants Evading Neutralizing Responses. Cell Host Microbe (2021) 293:322–4. doi: 10.1016/j.chom.2021.02.010 - DOI - PMC - PubMed
    1. Sidney J, Peters B, Frahm N, Brander C, Sette A. HLA Class I Supertypes: A Revised and Updated Classification. BMC Immunol (2008) 9:1–15. doi: 10.1186/1471-2172-9-1 - DOI - PMC - PubMed
    1. Stoddard CI, Galloway J, Chu HY, Shipley MM, Sung K, Itell HL, et al. . Epitope Profiling Reveals Binding Signatures of SARS-CoV-2 Immune Response in Natural Infection and Cross-Reactivity With Endemic Human CoVs. Cell Rep (2021) 358:109164. doi: 10.1016/j.celrep.2021.109164 - DOI - PMC - PubMed
    1. Moderbacher CR, Ramirez SI, Dan JM, Grifoni A, Hastie KM, Weiskopf D, et al. . Antigen-Specific Adaptive Immunity to SARS-CoV-2 in Acute COVID-19 and Associations With Age and Disease Severity. Cell (2020) 183:996–1012. doi: 10.1016/j.cell.2020.09.038 - DOI - PMC - PubMed
    1. Sekine T, Perez-Potti A, Rivera-Ballesteros O, Strålin K, Gorin J-B, Olsson A, et al. . Robust T Cell Immunity in Convalescent Individuals With Asymptomatic or Mild COVID-19. Cell (2020) 1831:158–68. doi: 10.1016/j.cell.2020.08.017 - DOI - PMC - PubMed

Substances