. 2022 Jun 22:13:853690.
doi: 10.3389/fimmu.2022.853690. eCollection 2022.

Strain Specific Variations in Acinetobacter baumannii Complement Sensitivity

Affiliations

Strain Specific Variations in Acinetobacter baumannii Complement Sensitivity

Gathoni Kamuyu et al. Front Immunol. .

Abstract

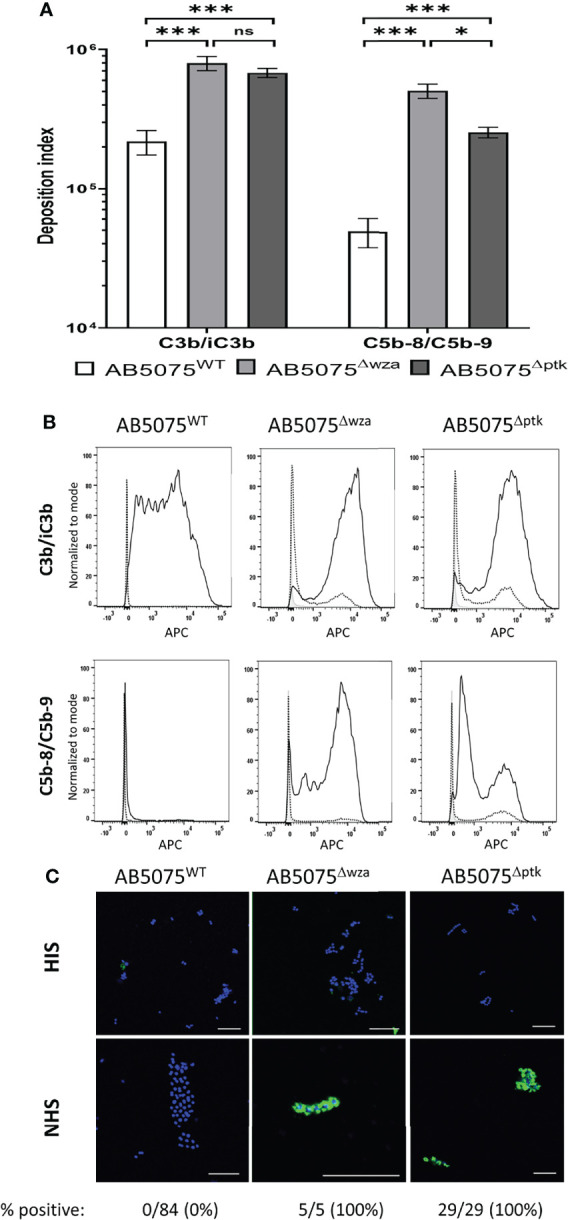
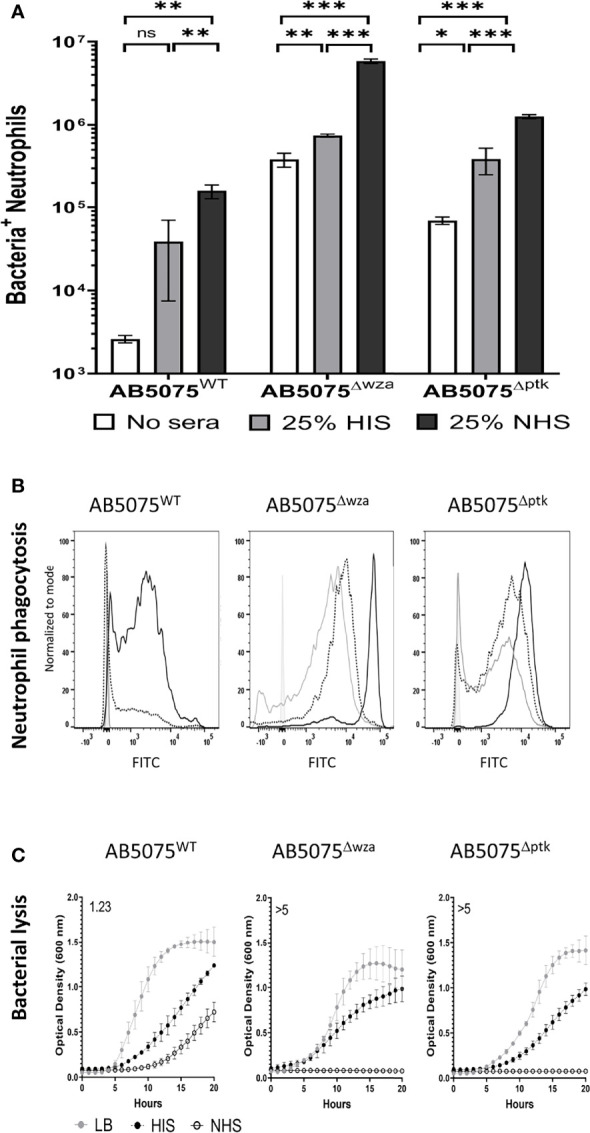
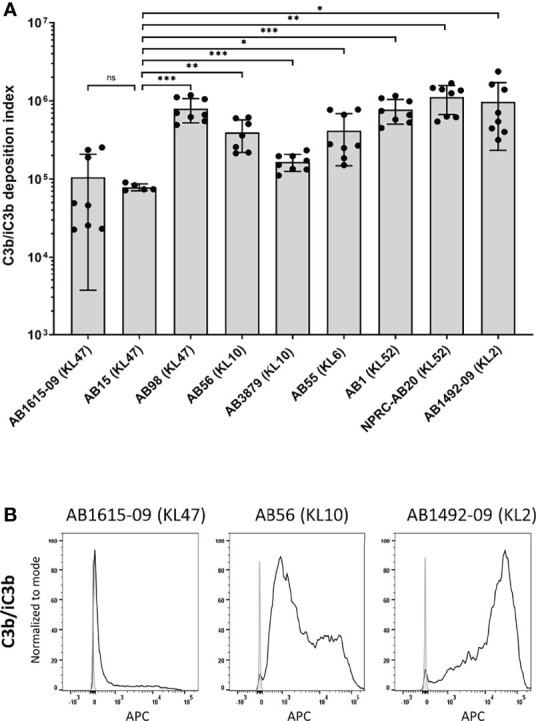
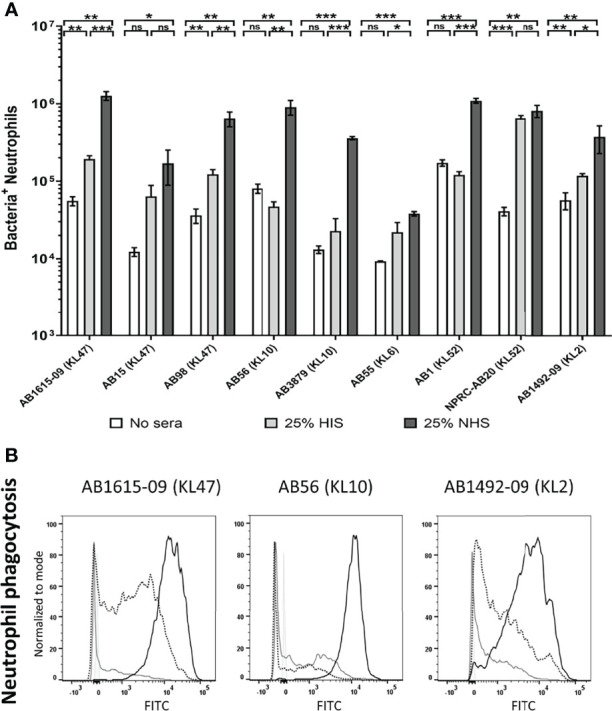
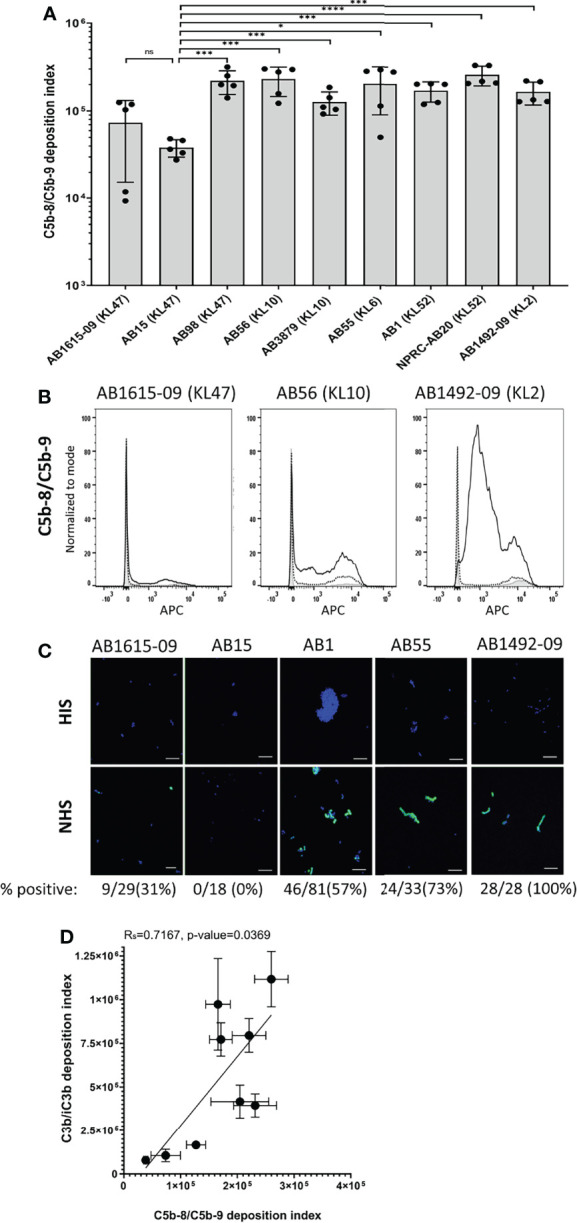
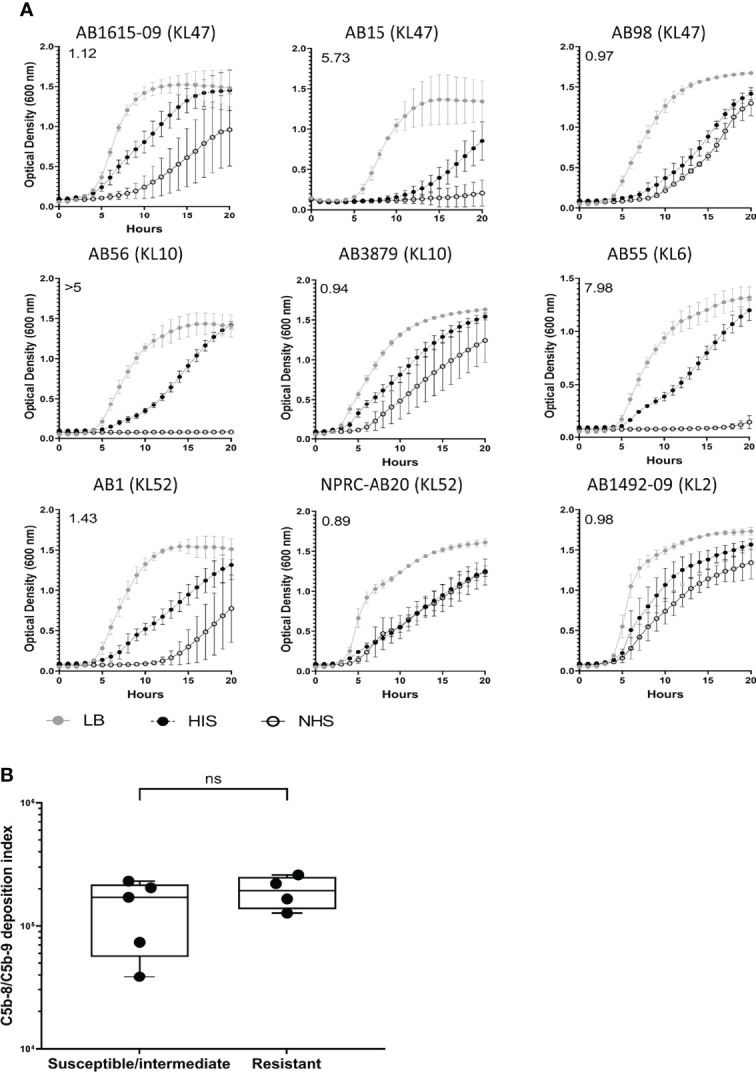
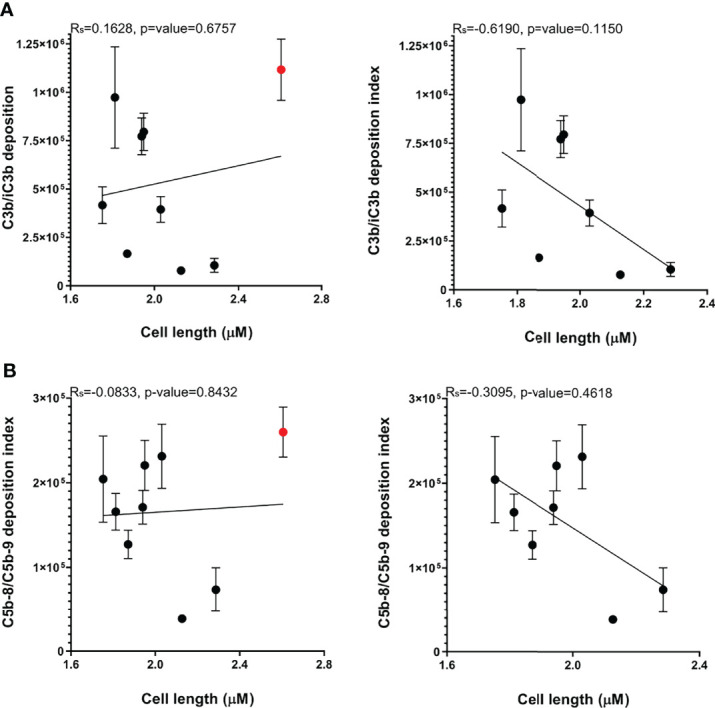
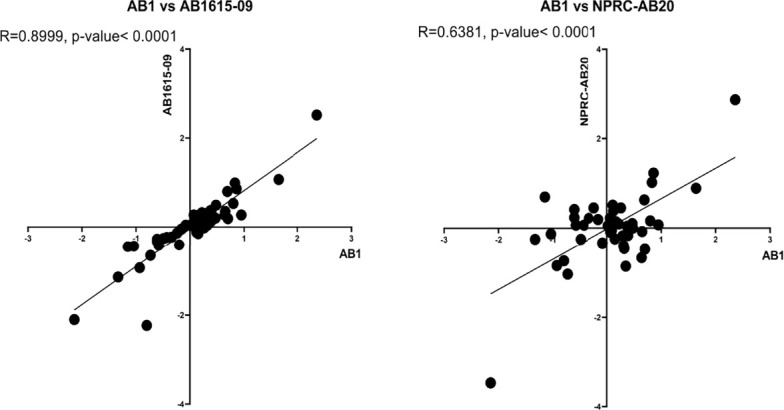
The complement system is required for innate immunity against Acinetobacter baumannii, an important cause of antibiotic resistant systemic infections. A. baumannii strains differ in their susceptibility to the membrane attack complex (MAC) formed from terminal complement pathway proteins, but the reasons for this variation remain poorly understood. We have characterized in detail the complement sensitivity phenotypes of nine A. baumannii clinical strains and some of the factors that might influence differences between strains. Using A. baumannii laboratory strains and flow cytometry assays, we first reconfirmed that both opsonization with the complement proteins C3b/iC3b and MAC formation were inhibited by the capsule. There were marked differences in C3b/iC3b and MAC binding between the nine clinical A. baumannii strains, but this variation was partially independent of capsule composition or size. Opsonization with C3b/iC3b improved neutrophil phagocytosis of most strains. Importantly, although C3b/iC3b binding and MAC formation on the bacterial surface correlated closely, MAC formation did not correlate with variations between A. baumannii strains in their levels of serum resistance. Genomic analysis identified only limited differences between strains in the distribution of genes required for serum resistance, but RNAseq data identified three complement-resistance genes that were differentially regulated between a MAC resistant and two MAC intermediate resistant strains when cultured in serum. These data demonstrate that clinical A. baumannii strains vary in their sensitivity to different aspects of the complement system, and that the serum resistance phenotype was influenced by factors in addition to the amount of MAC forming on the bacterial surface.

Keywords: Acinetobacter baumanniia; Gram negative bacteria; complement resistance/sensitivity; multi-drug resistance (MDR); virulence.


Conflict of interest statement

The authors declare that the research was conducted in the absence of any commercial or financial relationships that could be construed as a potential conflict of interest.

Figures

Figure 1
Figure 1
C3b/iC3b and C5b-8/C5b-9 deposition on the surface of wild-type and unencapsulated AB5075 isolates. 106 CFU of bacteria was incubated with 25% normal human sera followed by incubation with either the mouse monoclonal antibody 6C9 (Millipore) or aE11 (Abcam) and detected using an anti-mouse IgG conjugated to either allophycocyanin (APC) (Jackson Immunoresearch) (A) Bar graph showing the deposition index calculated by multiplying the percentage of bacteria staining positive for the respective complement factor and the median fluorescent intensity of the positive population. Bacteria incubated with PBS only followed by the primary and secondary antibody was used to determine the negative population. (B) Representative histograms showing the deposition of C3b/iC3b (top panel) and C5b-8/C5b-9 (bottom panel) on 106 CFU of the AB5075WT, AB5075Δwza and AB5075Δptk strains. Each graph shows a grey histogram that represents bacteria labelled with primary and secondary antibody only, while the black dotted and solid line represent bacteria incubated with heat-inactivated or normal human sera respectively. (C) Confocal imaging showing C5b-8/C5b-9 deposition on wild-type and unencapsulated AB5075Δwza and AB5075Δptk isolates following incubation with heat-inactivated sera (HIS) (top panel) or normal human sera (NHS) (bottom panel). Blue represent DAPI stained bacteria and green shows bacteria positive for MAC deposition. Figures below each panel represent the percentage of bacterial cells in each panel showing atleast some green fluorescent staining representing MAC deposition. A scale bar equivalent to 10 µm is indicated by a white line in all images. Bars represent mean values for each condition/strain and the error bars indicate standard deviations (SDs) (n = 3). T-test was used for statistical analysis *: p-value < 0.05, ***: p-value < 0.001, ns: p-value > 0.05. Representative data from two independent experiments is shown.
Figure 2
Figure 2
Human complement enhances neutrophil phagocytosis of wild-type and unencapsulated AB5075 isolates. FAMSE labelled encapsulated AB5075WT and unencapsulated AB5075Δwza and AB5075Δptk strains were opsonized with either 25% heat-inactivated human sera, 25% normal human sera or unopsonised (PBS only) and incubated with healthy human neutrophils at Bacteria: Neutrophil MOI of 100:1. (A) Shows the percentage of FAMSE+ve Neutrophils multiplied by the MFI of FAMSE+ve Neutrophils [Mean (± standard deviation)] on the Y axis. Phagocytosis indices in unopsonised bacteria or those incubated with heat-inactivated sera, or normal sera for each isolate is represented in the white, grey and black bars respectively. (B) Representative histograms showing phagocytosis of FAMSE labelled A. baumannii isolates incubated with either normal sera, heat-inactivated sera, or PBS only. Each graph shows a solid grey histogram that represents neutrophils only (no bacteria), open grey histogram represents phagocytosis of unopsonised bacteria, black-dotted line represents phagocytosis of HIS opsonized bacteria and black solid filled histogram line represent bacteria opsonized with NHS. (C) Growth curves showing bacterial OD600nm measurements over 24 hours obtained from bacteria incubated with either LB broth (grey circle), heat-inactivated sera (black circles) or normal human sera (open circle). Numbers on the top left corner indicate the doubling time ratio. The doubling time for each condition/strain was calculated to compare the growth rates of the three strains. Lower doubling times were observed in AB5075WT compared to either AB5075Δwza or AB5075Δptk in LB and HIS. Similarly, lower doubling times were observed in AB5075Δptk compared to AB5075Δwza. The lack of detectable bacterial growth in NHS for AB5075Δwza and AB5075Δptk prevented comparisons between strains analyses condition. Bars represent mean values for each condition/strain and the error bars indicate standard deviations (SDs) (n=3). T-test was used for statistical analysis *: p-value < 0.05, **: p-value < 0.01, ***: p-value < 0.001, ns: p-value > 0.05. Representative data from three independent experiments is shown.
Figure 3
Figure 3
Complement component C3b/iC3b deposition on the surface of clinical A. baumannii isolates. 106 CFU of bacteria was incubated with 25% normal human sera followed by incubation with the mouse monoclonal antibody 6C9 (Millipore) and detected using an anti-mouse IgG conjugated to allophycocyanin (APC) (Jackson Immunoresearch) (A) Bar graph showing the C3b deposition index computed by multiplying the percentage of bacteria staining positive for C3b/iC3b deposition and the median fluorescent intensity of the positive population (%Pos*MFI). (B) Representative histograms showing the deposition of C3b/iC3b on 1x10⁶ CFU of the three A. baumannii isolates. Each graph shows a grey histogram that represents bacteria labelled with primary and secondary antibody only and black solid line represent bacteria incubated with normal human sera. Bars represent mean values for each strain and the error bars indicate standard deviations (SDs) (n=8). T-test was used for statistical analysis *: p-value < 0.05, **: p-value < 0.01, ***: p-value < 0.001, ns: p-value > 0.05. Pooled data from three independent experiments is shown.
Figure 4
Figure 4
Human complement enhances neutrophil phagocytosis of clinical A. baumanni isolates. Nine FAMSE labelled A. baumannii isolates were opsonized with either 25% heat-inactivated human sera, 25% normal human sera or unopsonised (PBS only) and incubated with healthy human neutrophils at Bacteria: Neutrophil MOI of 200:1. (A) Shows the % of FAMSE+ve Neutrophils * MFI of FAMSE+ve Neutrophils [Mean (± standard deviation)] on the Y axis and the nine isolates with their capsule serotypes are indicated in brackets on the X-axis. Phagocytosis indices in unopsonised bacteria or those incubated with heat-inactivated sera, or normal sera for each isolate is represented in the white, grey, and black bars respectively. (B) Representative histograms showing phagocytosis of FAMSE labelled A. baumannii isolates incubated with either normal sera, heat-inactivated sera or PBS only. Each graph shows a solid grey histogram that represents neutrophils only (no bacteria), open grey histogram represents phagocytosis of unopsonised bacteria, black-dotted line represent phagocytosis of HIS opsonized bacteria and black solid filled histogram line represent bacteria opsonized with NS. Bars represent mean values for each condition/strain and the error bars indicate standard deviations (SDs) (n=3). T-test was used for statistical analysis *: p-value < 0.05, **: p-value < 0.01, ***: p-value < 0.001, ns: p-value > 0.05. Representative data from four independent experiments is shown.
Figure 5
Figure 5
Membrane attack complex (C5b-8/C5b-9) on the surface of clinical A. baumannii isolates. 106 CFU of bacteria was incubated with either 25% normal human sera or 25% heat-inactivated human sera, followed by incubation with the mouse monoclonal antibody aE11 (Abcam) that recognizes a neo-epitope on polymeric C9, and detected using an anti-mouse IgG conjugated to allophycocyanin (APC) (Jackson Immunoresearch). (A) Bar graph showing the C5b-8/C5b-9 deposition index (% positive * Median fluorescent intensity of bacteria staining positive for C5b-8/C5b-9 deposition). (B) Representative histograms showing the deposition of C5b-8/C5b-9 on 1x10⁶ CFU of three A. baumannii isolates. Each graph shows a grey histogram that represents bacteria labelled with primary and secondary antibody only, black-dotted line represents bacteria incubated with heat-inactivated human sera and black solid line represent bacteria incubated with normal human sera. (C) Confocal imaging showing C5b-8/C5b-9 deposition on a subset of A.baumannii clinical isolates following incubation with heat-inactivated sera (top panel) or normal sera (bottom panel). Blue represent DAPI stained bacteria and green shows bacteria positive for MAC deposition. Figures below each panel represent the percentage of bacterial cells in each panel showing atleast some green fluorescent staining representing MAC deposition. A scale bar equivalent to 10 µm is indicated by a white line in all images. (D) Correlation between C5b-8/C5b-9 deposition index and C3b/iC3b deposition on the nine clinical A. baumannii isolates. Bars represent mean values for each strain and the error bars indicate standard deviations (SDs) (n = 5). T-test was used for statistical analysis *: p-value < 0.05, ***: p-value < 0.001, ns: p-value > 0.05. Pooled data from two independent experiments is shown.
Figure 6
Figure 6
Clinical A. baumannii isolates predominantly show resistant or delayed sensitivity to human complement. 106 CFU of bacteria was incubated with 50% normal sera or 50% heat-inactivated sera and the bacterial growth monitored over 24 hours with OD600nm measurements obtained every 30 minutes. (A) Growth curves showing bacterial OD600nm measurements over 24 hours obtained from bacteria incubated with either LB broth (grey circle), heat-inactivated sera (black circles) or normal human sera (open circle). Numbers on the top left corner indicate the doubling time ratio. (B) Box and whisker graph comparing C5b-8/C5b-9 deposition levels in isolates classified as either susceptible, intermediate, or resistant to complement lysis. Line graphs indicate the mean value, and the error bars indicate standard deviations (SDs) (n = 9). Pooled data from three independent experiments is shown. ns: p-value > 0.05.
Figure 7
Figure 7
Bacterial cell length varies between A. baumannii clinical strains but does not correlate with C3b/iC3b, or C5b-8/C5b-9 deposition. The cell length measurements of a minimum of 400 representative bacteria of the nine A. baumannii strains were determined. (A) Correlation between median cell length and C3b/iC3b deposition in the nine clinical strains (left panel) or excluding the NPRC-AB20 strain (right panel) (B) Correlation between median cell length and C5b-8/C5b-9 deposition in the nine clinical strains (left panel) or excluding the NPRC-AB20 strain (right panel).
Figure 8
Figure 8
Complement resistance gene transcription levels correlate between phenotypically similar A. baumannii clinical strains. The relative expression levels of 52 complement resistance genes was determined in the complement resistant strain, NPRC-AB20 and two intermediate susceptible strains, AB1 and AB1615-09. Correlation between fold changes in expression of the 52 genes between the AB1 and AB1615-09 strain (left panel) and AB1 and the NPRC-AB20 strain (right panel).

References

    1. Goldberg BS, Ackerman ME. Antibody-Mediated Complement Activation in Pathology and Protection. Immunol Cell Biol (2020) 98(4):305–17. doi: 10.1111/imcb.12324 - DOI - PMC - PubMed
    1. Walport MJ. Complement. First of Two Parts. N Engl J Med (2001) 344(14):1058–66. doi: 10.1056/NEJM200104053441406 - DOI - PubMed
    1. Zipfel PF, Hallstrom T, Riesbeck K. Human Complement Control and Complement Evasion by Pathogenic Microbes–Tipping the Balance. Mol Immunol (2013) 56(3):152–60. doi: 10.1016/j.molimm.2013.05.222 - DOI - PubMed
    1. Johnson JR. Virulence Factors in Escherichia Coli Urinary Tract Infection. Clin Microbiol Rev (1991) 4(1):80–128. doi: 10.1128/CMR.4.1.80 - DOI - PMC - PubMed
    1. Hyams C, Yuste J, Bax K, Camberlein E, Weiser JN, Brown JS. Streptococcus Pneumoniae Resistance to Complement-Mediated Immunity is Dependent on the Capsular Serotype. Infect Immun (2010) 78(2):716–25. doi: 10.1128/IAI.01056-09 - DOI - PMC - PubMed

Publication types

MeSH terms

Substances

LinkOut - more resources