. 2022 Jun 24:13:897366.
doi: 10.3389/fimmu.2022.897366. eCollection 2022.

Dissecting the Single-Cell Transcriptome Network of Immune Environment Underlying Cervical Premalignant Lesion, Cervical Cancer and Metastatic Lymph Nodes

Affiliations

Dissecting the Single-Cell Transcriptome Network of Immune Environment Underlying Cervical Premalignant Lesion, Cervical Cancer and Metastatic Lymph Nodes

Chunbo Li et al. Front Immunol. .

Erratum in

Abstract

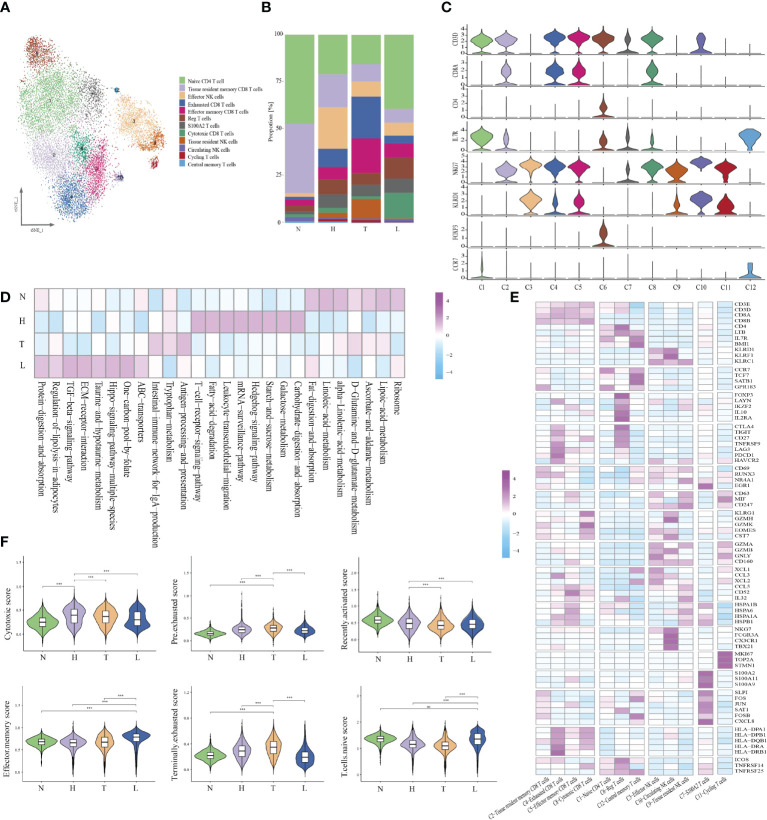
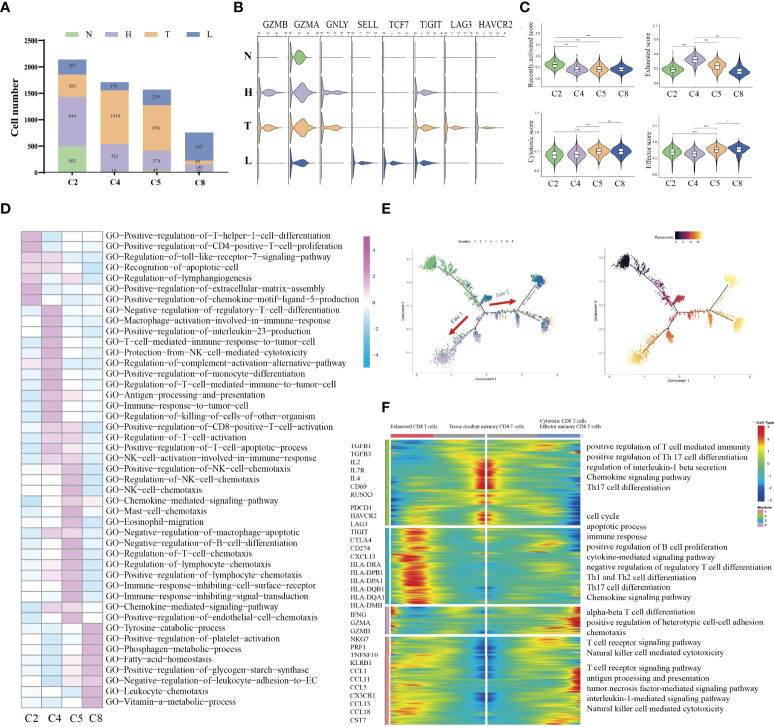
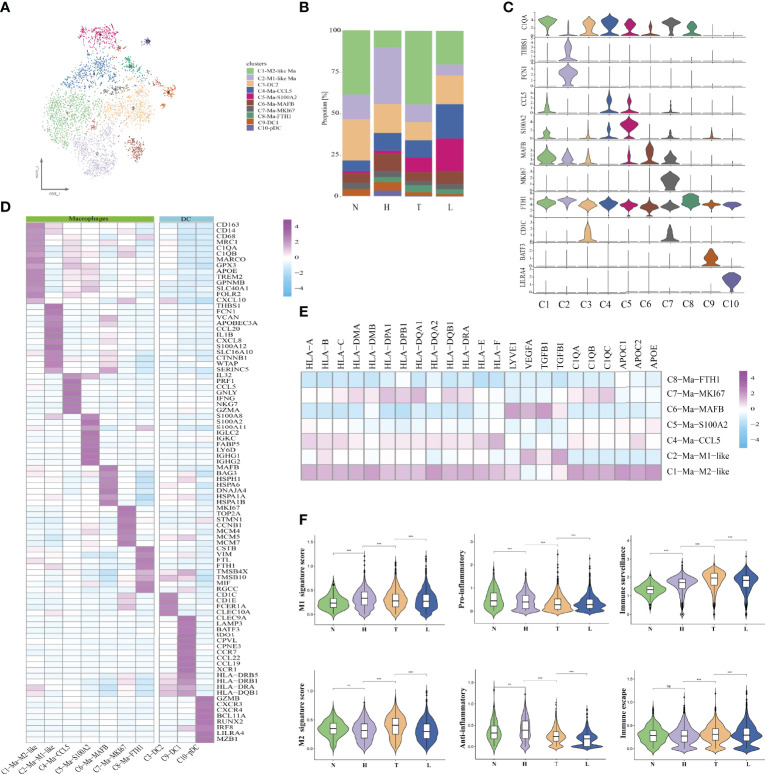
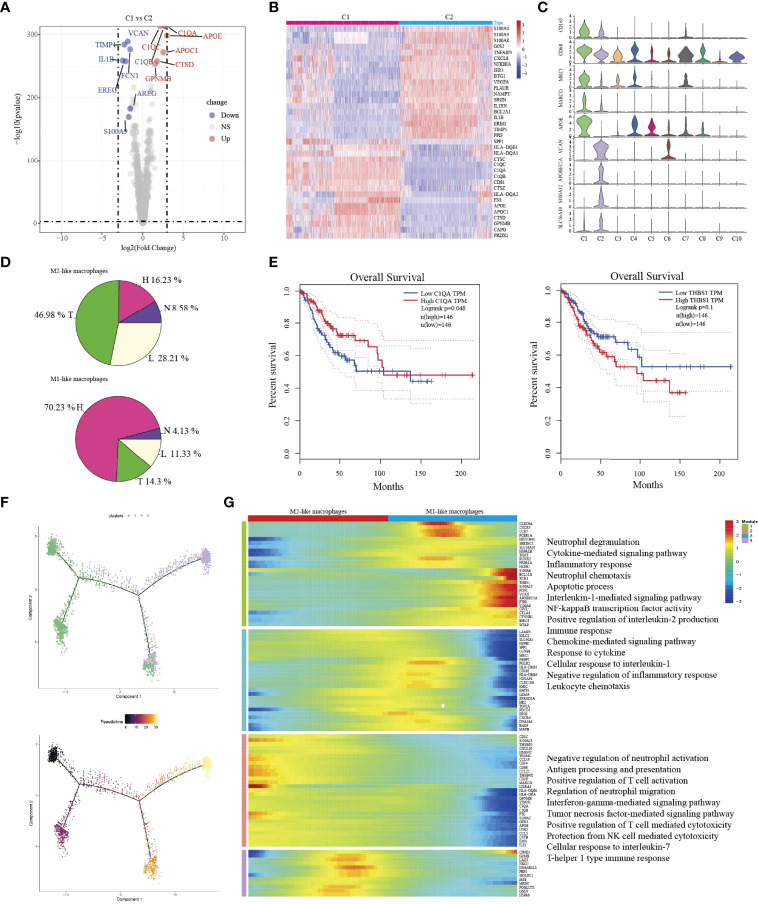
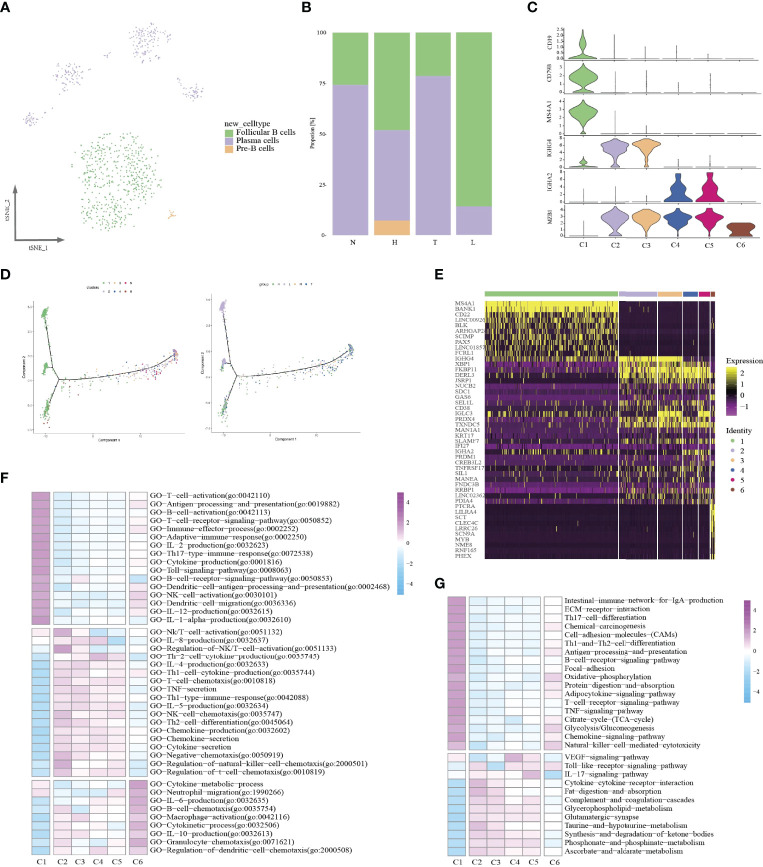
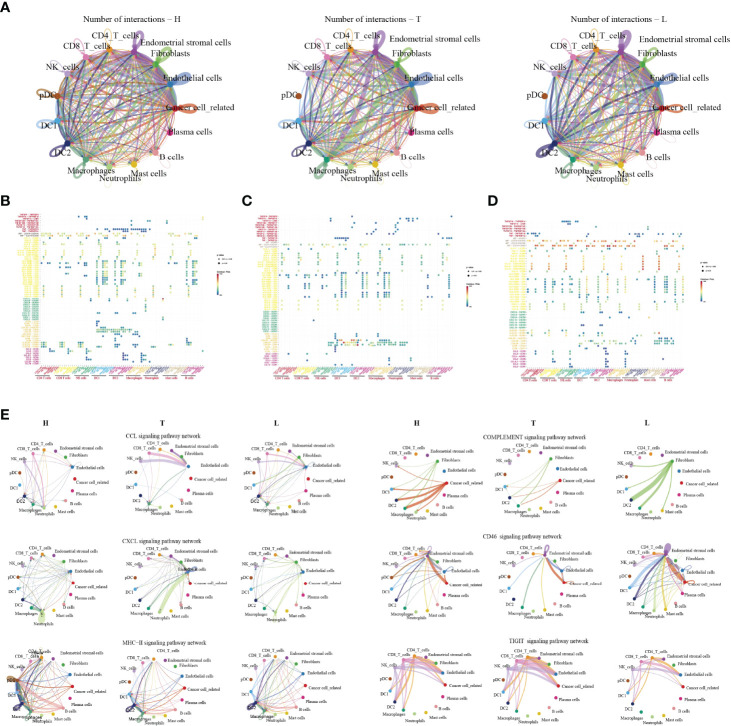
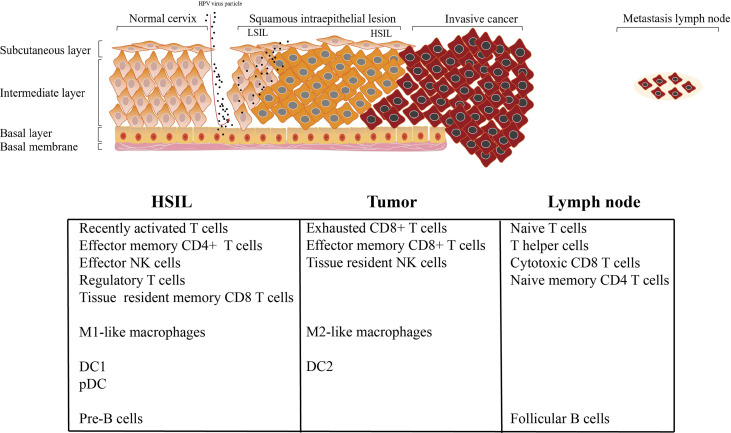
Cervical cancer (CC) is one of the most common malignancy in women worldwide. It is characterized by a natural continuous phenomenon, that is, it is in the initial stage of HPV infection, progresses to intraepithelial neoplasia, and then develops into invasion and metastasis. Determining the complexity of tumor microenvironment (TME) can deepen our understanding of lesion progression and provide novel therapeutic strategies for CC. We performed the single-cell RNA sequencing on the normal cervix, intraepithelial neoplasia, primary tumor and metastatic lymph node tissues to describe the composition, lineage, and functional status of immune cells and mesenchymal cells at different stages of CC progression. A total of 59913 single cells were obtained and divided into 9 cellular clusters, including immune cells (T/NK cells, macrophages, B cells, plasma cells, mast cells and neutrophils) and mesenchymal cells (endothelial cells, smooth muscle cells and fibroblasts). Our results showed that there were distinct cell subpopulations in different stages of CC. High-stage intraepithelial neoplasia (HSIL) tissue exhibited a low, recently activated TME, and it was characterized by high infiltration of tissue-resident CD8 T cell, effector NK cells, Treg, DC1, pDC, and M1-like macrophages. Tumor tissue displayed high enrichment of exhausted CD8 T cells, resident NK cells and M2-like macrophages, suggesting immunosuppressive TME. Metastatic lymph node consisted of naive T cell, central memory T cell, circling NK cells, cytotoxic CD8+ T cells and effector memory CD8 T cells, suggesting an early activated phase of immune response. This study is the first to delineate the transcriptome profile of immune cells during CC progression using single-cell RNA sequencing. Our results indicated that HSIL exhibited a low, recently activated TME, tumor displayed immunosuppressive statue, and metastatic lymph node showed early activated phase of immune response. Our study enhanced the understanding of dynamic change of TME during CC progression and has implications for the development of novel treatments to inhibit the initiation and progression of CC.

Keywords: cervical cancer; immune cell; single-cell sequencing; squamous cell carcinoma; tumor microenvironment.


Conflict of interest statement

The authors declare that the research was conducted in the absence of any commercial or financial relationships that could be construed as a potential conflict of interest.

Figures

Figure 1
Figure 1
Single-Cell profiling of diverse immune cells from four groups (Normal cervix, HSIL, tumor and metastatic lymph nodes). Overview of the study workflow (A). t-SNE plot and proportions of all cells annotated by the ten patients from four groups (B). t-SNE plot of all cell types across samples from four groups (C). Proportions of all cell types in each group (D). Expression of cell-type-specific marker genes illustrated in t-SNE plots (E).
Figure 2
Figure 2
Identifying distinct NK/T cell clusters in all samples. t-SNE projection of 12 subsets of NK/T cells (each dot corresponds to one single cell) (A). Proportions of all cell types clusters in each group (B). Violin plots presenting the distribution module score for selected genes for each group (C). Heatmap indicating the expression of selected gene sets in NK/T subtypes (D). Heatmap indicating the enrichment of signaling pathway in four groups (GSVA KEGG) (E). Violin plots showing the scores of functional modules for four groups, using the AddModuleScore function. Error bars indicated the means ± SD. (***P < 0.001). NS, no significant (F).
Figure 3
Figure 3
Difference of immune state among four groups (N, H, T, and L). Proportions of each CD8+ T cell cluster among four groups (A). Violin plots showing the distribution module score for selected genes for each CD8+ T cells cluster. Error bars indicated the means ± SD (B). Violin plots showing the scores of functional modules for each cell CD8+ T cluster, using the AddModuleScore function. (*P < 0.05; ***P < 0.001) (C). Heatmap indicating the enrichment of signaling pathway among four CD8+ T cells cluster (GSVA GO) (D). Trajectory of all CD8+ T cell clusters from all group along pseudotime in a two-dimensional state-space defined by Monocle2. Each point corresponds to a single cell, and each color represents a CD8+ T cell cluster (E). Heatmap indicating the differentially expressed genes (rows) along the pseudotime (F). NS, no significant.
Figure 4
Figure 4
Identifying distinct myeloid cell clusters in all samples. t-SNE projection of 10 subsets of myeloid cells (each dot corresponds to one single cell) shown in different colors (A). Proportions of all cell types clusters among four groups (B). Violin plots representing the distribution module score for selected genes for each cluster. Error bars indicated the means ± SD (C). Heatmap indicating the expression of selected gene sets in myeloid cell subtypes (D). Heatmap indicating the differentially expressed genes in seven macrophages subtypes (E). Violin plots showing the scores of functional modules for each macrophages cluster, using the AddModuleScore function. (**P < 0.01; ***P < 0.001) (F). NS, no significant.
Figure 5
Figure 5
The transition of two types of macrophages during tumor progression. Volcano plot showing the top differently genes between two types of macrophages (A). Heatmap indicating differently genes between two types of macrophages (B). Violin plots showing the distribution module score for selected genes for each cluster. Error bars indicated the means ± SD (C). Pie graph showing the proportions of cells among four groups (D). Kaplan–Meier curve showing survival of C1QA, and THBS1 genes in TCGA-SCC patients (E). Trajectory of both two macrophage clusters along pseudotime in a two-dimensional state-space defined by Monocle2. Each point corresponds to a single cell, and each color represents a macrophage cluster (F). Heatmap indicating the differentially expressed genes (rows) along the pseudotime (G).
Figure 6
Figure 6
Identifying distinct B cell clusters in all samples. t-SNE projection of three cell types of B cells (each dot corresponds to one single cell) shown in different colors (A). Proportions of all cell types clusters among four groups (B). Violin plots representing the distribution module score for selected genes for each cluster. Error bars indicated the means ± SD (C). Trajectory of all B cell clusters along pseudotime in a two-dimensional state-space defined by Monocle2. Each point corresponds to a single cell (D). Heatmap indicating differently genes among six clusters (E). Heatmap showing the enrichment of biological function in six B cell clusters (GSVA GO) (F). Heatmap showing the enrichment of biological function in six B cell clusters (GSVA KEGG) (G).
Figure 7
Figure 7
The dense network and multiple cellular connections. Circos plot showing the interactions between ligands and receptors across cell types in HSIL(left), tumor (middle), and lymph node (right) (A). Bubble diagram showing MHC moleculars, immune receptors, chemokine and immune checkpint among different immune cells in HSIL (B), tumor (C) and lymph node (D). The association of different signaling pathways among different immune cells in HSIL, tumor and lymph node group (E).
Figure 8
Figure 8
Summary of conclusion.

Similar articles

Cited by

References

    1. Vu M, Yu J, Awolude OA, Chuang L. Cervical Cancer Worldwide. Curr Probl Cancer (2018) 42(5):457–65. doi: 10.1016/j.currproblcancer.2018.06.003 - DOI - PubMed
    1. Cohen PA, Jhingran A, Oaknin A, Denny L. Cervical Cancer. Lancet (2019) 393(10167):169–82. doi: 10.1016/S0140-6736(18)32470-X - DOI - PubMed
    1. Hu Z, Ma D. The Precision Prevention and Therapy of HPV-Related Cervical Cancer: New Concepts and Clinical Implications. Cancer Med (2018) 7(10):5217–36. doi: 10.1002/cam4.1501 - DOI - PMC - PubMed
    1. Burd EM. Human Papillomavirus and Cervical Cancer. Clin Microbiol Rev (2003) 16(1):1–17. doi: 10.1128/CMR.16.1.1-17.2003 - DOI - PMC - PubMed
    1. Lin M, Ye M, Zhou J, Wang ZP, Zhu X. Recent Advances on the Molecular Mechanism of Cervical Carcinogenesis Based on Systems Biology Technologies. Comput Struct Biotechnol J (2019) 17:241–50. doi: 10.1016/j.csbj.2019.02.001 - DOI - PMC - PubMed

Publication types