

Identification of CFHR4 as a Potential Prognosis Biomarker Associated With lmmune Infiltrates in Hepatocellular Carcinoma
- PMID: 35812416
- PMCID: PMC9257081
- DOI: 10.3389/fimmu.2022.892750
Identification of CFHR4 as a Potential Prognosis Biomarker Associated With lmmune Infiltrates in Hepatocellular Carcinoma
Abstract
Background: Complement factor H-related 4 (CFHR4) is a protein-coding gene that plays an essential role in multiple diseases. However, the prognostic value of CFHR4 in hepatocellular carcinoma (HCC) is unknown.
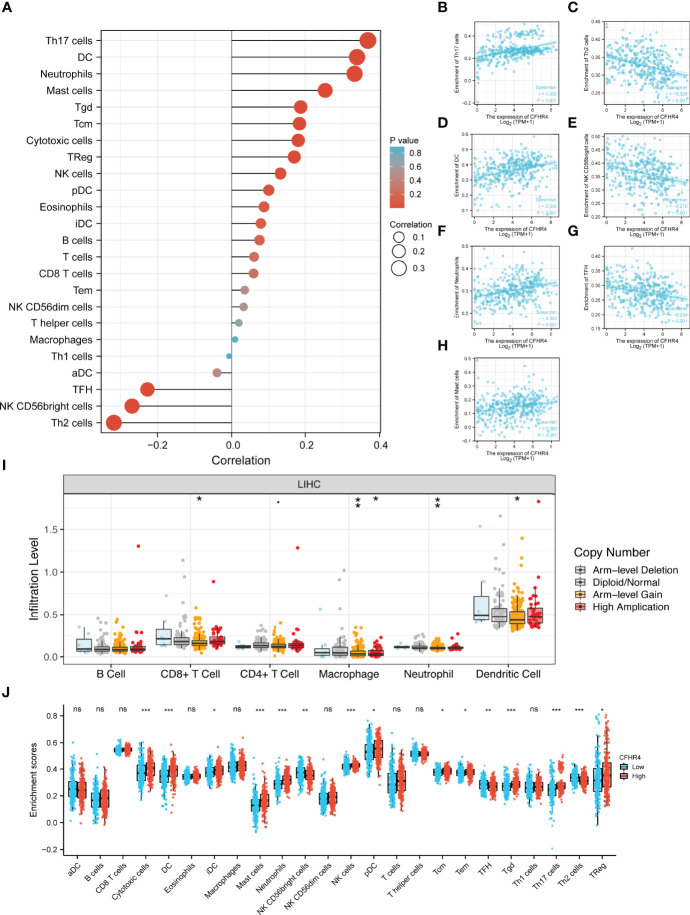
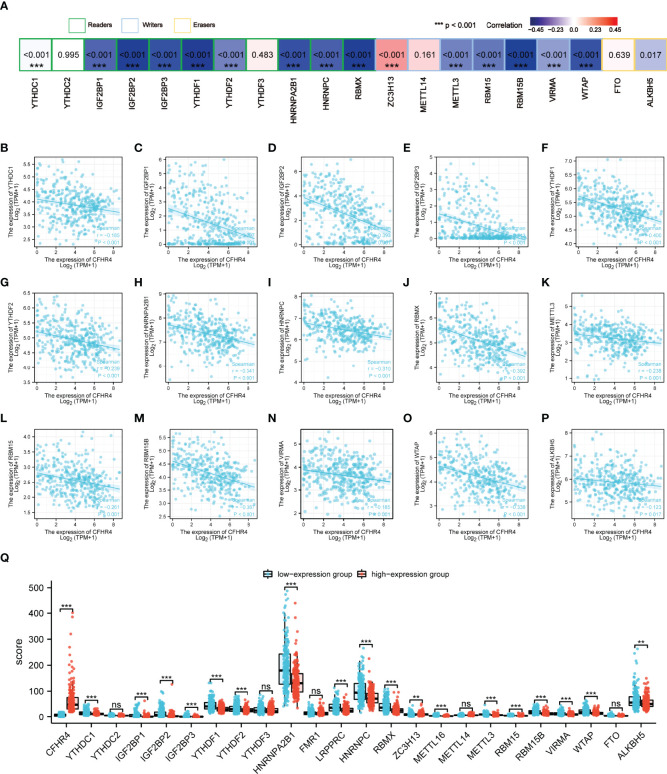
Methods: Using multiple databases, we investigated CFHR4 expression levels in HCC and multiple cancers. The relationship between CFHR4 expression levels and clinicopathological variables was further analyzed. Various potential biological functions and regulatory pathways of CFHR4 in HCC were identified by performing a Gene Ontology (GO) analysis, Kyoto Encyclopedia of Genes and Genomes (KEGG) analysis and Gene Set Enrichment Analysis (GSEA). Single-sample gene set enrichment analysis (ssGSEA) was performed to confirm the correlation between CFHR4 expression and immune cell infiltration. The correlations between CFHR4 expression levels in HCC and N6-methyladenosine (m6A) modifications and the competing endogenous RNA (ceRNA) regulatory networks were confirmed in TCGA cohort.
Results: CFHR4 expression levels were significantly decreased in HCC tissues. Low CFHR4 expression in HCC tissues was significantly correlated with the patients' sex, race, age, TNM stage, pathological stage, tumor status, residual tumor, histologic grade and alpha fetal protein (AFP) level. GO and KEGG analyses revealed that differentially expressed genes related to CFHR4 may be involved in the synaptic membrane, transmembrane transporter complex, gated channel activity, chemical carcinogenesis, retinol metabolism, calcium signaling pathway, PPAR signaling pathway, insulin and gastric acid secretion. GSEA revealed that the FCGR-activated reaction, PLK1 pathway, ATR pathway, MCM pathway, cascade reactions of PI3K and FGFR1, reactant-mediated MAPK activation and FOXM1 pathway were significantly enriched in HCC with low CFHR4 expression. Moreover, CFHR4 expression was inversely correlated the levels of infiltrating Th2 cells, NK CD56bright cells and Tfh cells. In contrast, we observed positive correlations with the levels of infiltrating DCs, neutrophils, Th17 cells and mast cells. CFHR4 expression showed a strong correlation with various immunomarker groups in HCC. In addition, high CFHR4 expression significantly prolonged the overall survival (OS), disease-specific survival (DSS) and progression-free interval (PFI). We observed a substantial correlation between the expression of CFHR4 and multiple N6-methyladenosine genes in HCC and constructed potential CFHR4-related ceRNA regulatory networks.
Conclusions: CFHR4 might be a potential therapeutic target for improving the HCC prognosis and is closely related to immune cell infiltration.
Keywords: CFHR4; biomarker; hepatocellular carcinoma; immune Infiltrate; prognosis.
Copyright © 2022 Yu, Wang, Ke, Bai, Xu, Lu, Feng, Qian, Xu, Zhou, Li, Yin, Li, Hua, Zhou, Pan, Fu and Ma.
Conflict of interest statement
The authors declare that the research was conducted in the absence of any commercial or financial relationships that could be construed as a potential conflict of interest.
Figures


Similar articles
-
Characterization of prognostic value and immunological roles of RAB22A in hepatocellular carcinoma.Front Immunol. 2023 Mar 3;14:1086342. doi: 10.3389/fimmu.2023.1086342. eCollection 2023. Front Immunol. 2023. PMID: 36936971 Free PMC article.
-
Identification of CFHR4 associated with poor prognosis of hepatocellular carcinoma.Front Oncol. 2022 Oct 20;12:812663. doi: 10.3389/fonc.2022.812663. eCollection 2022. Front Oncol. 2022. PMID: 36338737 Free PMC article.
-
Over-expression of RRM2 predicts adverse prognosis correlated with immune infiltrates: A potential biomarker for hepatocellular carcinoma.Front Oncol. 2023 Mar 28;13:1144269. doi: 10.3389/fonc.2023.1144269. eCollection 2023. Front Oncol. 2023. PMID: 37056349 Free PMC article.
-
Reconstruction and Analysis of the Differentially Expressed IncRNA-miRNA-mRNA Network Based on Competitive Endogenous RNA in Hepatocellular Carcinoma.Crit Rev Eukaryot Gene Expr. 2019;29(6):539-549. doi: 10.1615/CritRevEukaryotGeneExpr.2019028740. Crit Rev Eukaryot Gene Expr. 2019. PMID: 32422009 Review.
-
LINC00324 in cancer: Regulatory and therapeutic implications.Front Oncol. 2022 Dec 22;12:1039366. doi: 10.3389/fonc.2022.1039366. eCollection 2022. Front Oncol. 2022. PMID: 36620587 Free PMC article. Review.
Cited by
-
Exploration of potential novel drug targets for diabetic retinopathy by plasma proteome screening.Sci Rep. 2024 May 22;14(1):11726. doi: 10.1038/s41598-024-62069-0. Sci Rep. 2024. PMID: 38778174 Free PMC article.
-
LMNB1/CDKN1A Signaling Regulates the Cell Cycle and Promotes Hepatocellular Carcinoma Progression.Curr Cancer Drug Targets. 2025;25(6):620-635. doi: 10.2174/0115680096299107240427073527. Curr Cancer Drug Targets. 2025. PMID: 38778606
-
Clinical Significance of a Novel Vasculogenic Mimicry-based Prognostic Model in Hepatocellular Carcinoma.Curr Med Chem. 2025;32(19):3926-3940. doi: 10.2174/0109298673298862240510073543. Curr Med Chem. 2025. PMID: 38757323 Free PMC article.
-
Machine learning identification of cuproptosis and necroptosis-associated molecular subtypes to aid in prognosis assessment and immunotherapy response prediction in low-grade glioma.Front Genet. 2022 Sep 12;13:951239. doi: 10.3389/fgene.2022.951239. eCollection 2022. Front Genet. 2022. PMID: 36186436 Free PMC article.
-
Integrated multi-omics analysis and machine learning refine molecular subtypes and clinical outcome for hepatocellular carcinoma.Hereditas. 2025 Apr 12;162(1):61. doi: 10.1186/s41065-025-00431-6. Hereditas. 2025. PMID: 40221783 Free PMC article.
References
MeSH terms
Substances
LinkOut - more resources
Full Text Sources
Medical
Molecular Biology Databases
Miscellaneous