

Activation of Cholinergic Anti-Inflammatory Pathway Ameliorates Cerebral and Cardiac Dysfunction After Intracerebral Hemorrhage Through Autophagy
- PMID: 35812436
- PMCID: PMC9260497
- DOI: 10.3389/fimmu.2022.870174
Activation of Cholinergic Anti-Inflammatory Pathway Ameliorates Cerebral and Cardiac Dysfunction After Intracerebral Hemorrhage Through Autophagy
Abstract
Background: Intracerebral hemorrhage (ICH) is the devastating subtype of stroke with cardiovascular complications, resulting in high rates of mortality and morbidity with the release of inflammatory factors. Previous studies have demonstrated that activation of α7nAChR can reduce immune and inflammation-related diseases by triggering the cholinergic anti-inflammatory pathway (CAIP). α7nAChR mediates protection from nervous system inflammation through AMPK-mTOR-p70S6K-associated autophagy. Therefore, the purpose of this study is to explore whether the activation of α7nAChR improves cerebral and cardiac dysfunction after ICH through autophagy.
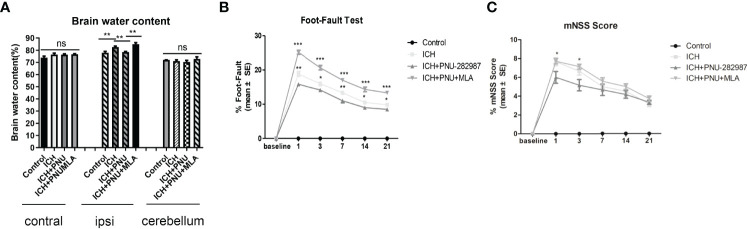
Methods: Male C57BL/6 mice were randomly divided into five groups (1): Control + saline (2), ICH+ saline (3), ICH + PNU-282987 (4), ICH+ PNU-282987 + MLA (5), ICH + PNU-282987 + 3-MA. The neurological function was evaluated at multiple time points. Brain water content was measured at 3 days after ICH to assess the severity of brain edema. PCR, immunofluorescence staining, and Western Blot were performed at 7 days after ICH to detect inflammation and autophagy. Picro-Sirius Red staining was measured at 30 days after ICH to evaluate myocardial fibrosis, echocardiography was performed at 3 and 30 days to measure cardiac function.
Results: Our results indicated that the PNU-282987 reduced inflammatory factors (MCP-1, IL-1β, MMP-9, TNF-α, HMGB1, TLR2), promoted the polarization of macrophage/microglia into anti-inflammatory subtypes(CD206), repaired blood-brain barrier injury (ZO-1, Claudin-5, Occludin), alleviated acute brain edema and then recovered neurological dysfunction. Echocardiography and PSR indicated that activation of α7nAChR ameliorated cardiac dysfunction. Western Blot showed that activation of α7nAChR increased autophagy protein (LC3, Beclin) and decreased P62. It demonstrated that the activation of α7nAChR promotes autophagy and then recovers brain and heart function after ICH.
Conclusions: In conclusion, PNU-282987 promoted the cerebral and cardiac functional outcomes after ICH in mice through activated α7nAChR, which may be attributable to promoting autophagy and then reducing inflammatory reactions after ICH.
Keywords: autophagy; inflammation; intracerebral hemorrhage; macrophage; α7nAChR.
Copyright © 2022 Su, Zhang, Zhang, Yuan, Wu, Liu, Wuri, Li and Yan.
Conflict of interest statement
The authors declare that the research was conducted in the absence of any commercial or financial relationships that could be construed as a potential conflict of interest.
Figures


Similar articles
-
α7 Nicotinic Acetylcholine Receptor Stimulation Attenuates Neuroinflammation through JAK2-STAT3 Activation in Murine Models of Intracerebral Hemorrhage.Biomed Res Int. 2017;2017:8134653. doi: 10.1155/2017/8134653. Epub 2017 Apr 26. Biomed Res Int. 2017. PMID: 28529954 Free PMC article.
-
α7 nicotinic acetylcholine receptor agonism confers neuroprotection through GSK-3β inhibition in a mouse model of intracerebral hemorrhage.Stroke. 2012 Mar;43(3):844-50. doi: 10.1161/STROKEAHA.111.639989. Epub 2011 Dec 29. Stroke. 2012. PMID: 22207510 Free PMC article.
-
Macrophage α7nAChR alleviates the inflammation of neonatal necrotizing enterocolitis through mTOR/NLRP3/IL-1β pathway.Int Immunopharmacol. 2024 Sep 30;139:112590. doi: 10.1016/j.intimp.2024.112590. Epub 2024 Jul 13. Int Immunopharmacol. 2024. PMID: 38996778
-
α7nACh receptor, a promising target to reduce BBB damage by regulating inflammation and autophagy after ischemic stroke.Biomed Pharmacother. 2024 Oct;179:117337. doi: 10.1016/j.biopha.2024.117337. Epub 2024 Aug 27. Biomed Pharmacother. 2024. PMID: 39191022 Review.
-
Progress in translational research on intracerebral hemorrhage: is there an end in sight?Prog Neurobiol. 2014 Apr;115:45-63. doi: 10.1016/j.pneurobio.2013.09.007. Epub 2013 Oct 16. Prog Neurobiol. 2014. PMID: 24139872 Free PMC article. Review.
Cited by
-
Potential blood biomarkers that can be used as prognosticators of spontaneous intracerebral hemorrhage: A systematic review and meta-analysis.PLoS One. 2025 Feb 19;20(2):e0315333. doi: 10.1371/journal.pone.0315333. eCollection 2025. PLoS One. 2025. PMID: 39970158 Free PMC article.
-
Autophagy regulates inflammation in intracerebral hemorrhage: Enemy or friend?Front Cell Neurosci. 2023 Jan 16;16:1036313. doi: 10.3389/fncel.2022.1036313. eCollection 2022. Front Cell Neurosci. 2023. PMID: 36726453 Free PMC article. Review.
-
Novel inflammatory markers in intracerebral hemorrhage: Results from Olink proteomics analysis.FASEB J. 2025 Jan 31;39(2):e70341. doi: 10.1096/fj.202402183RR. FASEB J. 2025. PMID: 39853806 Free PMC article.
-
α7nAChR on B cells directs T cell differentiation to prevent viral myocarditis.JCI Insight. 2025 May 8;10(9):e189323. doi: 10.1172/jci.insight.189323. eCollection 2025 May 8. JCI Insight. 2025. PMID: 40337863 Free PMC article.
-
Unveiling the Molecular Mechanisms of Rosacea: Insights From Transcriptomics and In Vitro Experiments.J Cosmet Dermatol. 2025 Jan;24(1):e16753. doi: 10.1111/jocd.16753. J Cosmet Dermatol. 2025. PMID: 39823143 Free PMC article.
References
-
- Xu C, Wang T, Cheng S, Liu Y. Increased Expression of T Cell Immunoglobulin and Mucin Domain 3 Aggravates Brain Inflammation Via Regulation of the Function of Microglia/Macrophages After Intracerebral Hemorrhage in Mice. J Neuroinflamm (2013) 10:141. doi: 10.1186/1742-2094-10-141 - DOI - PMC - PubMed
MeSH terms
Substances
LinkOut - more resources
Full Text Sources
Medical
Miscellaneous