

Keeping the lights On or Off: tracking the progress of access to electricity for sustainable development in Nigeria
- PMID: 35812840
- PMCID: PMC9251031
- DOI: 10.1007/s10708-022-10689-2
Keeping the lights On or Off: tracking the progress of access to electricity for sustainable development in Nigeria
Abstract
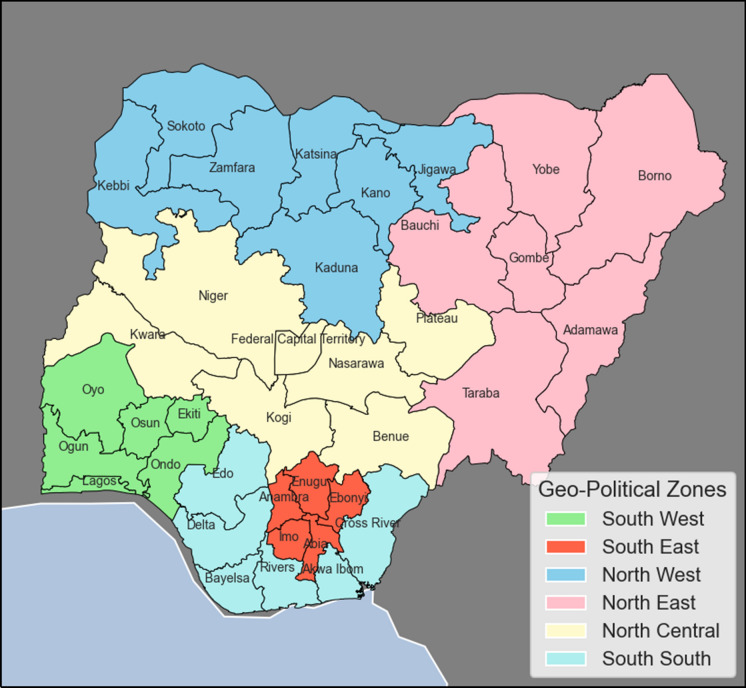
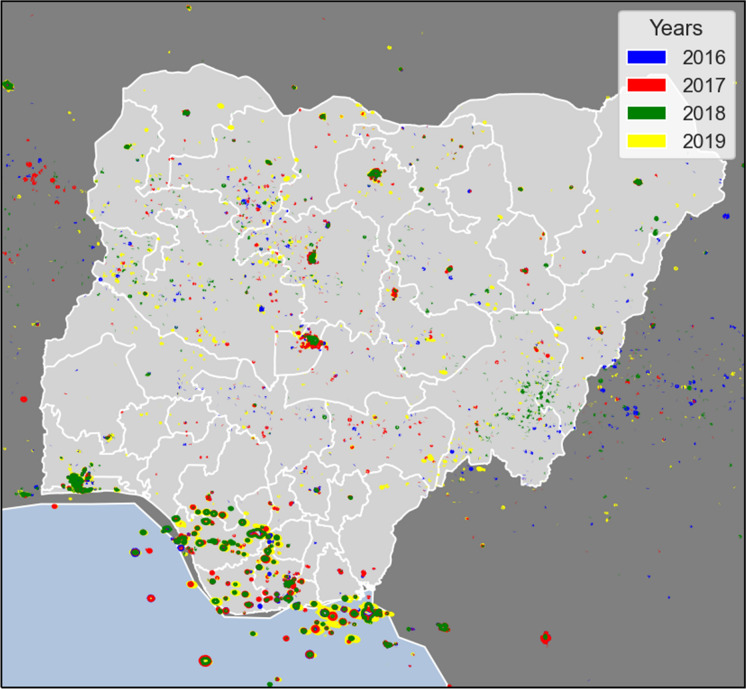
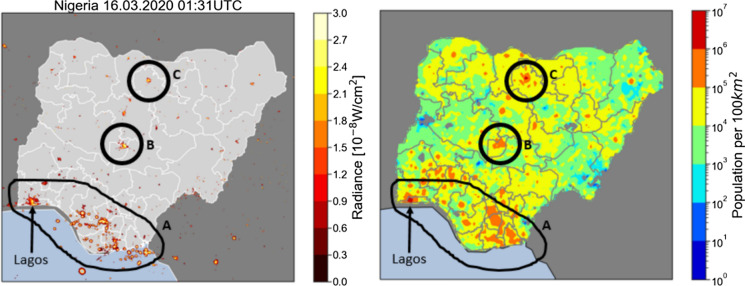
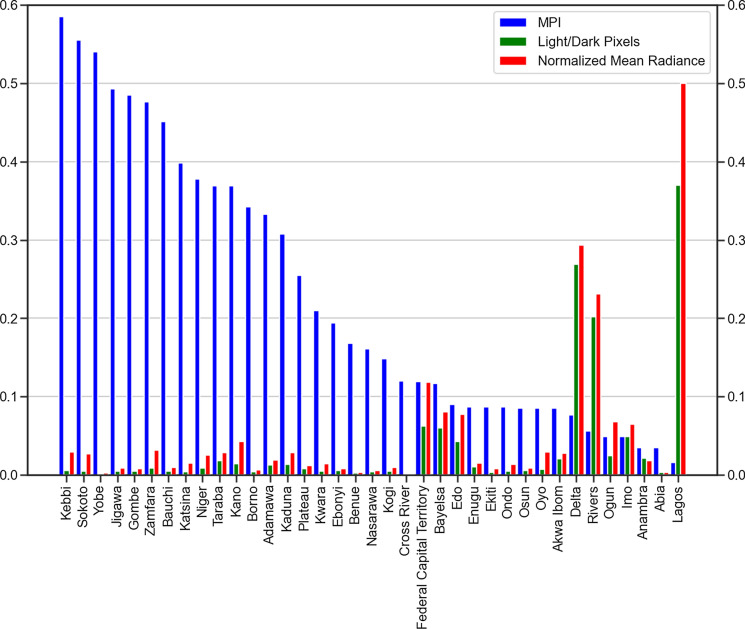
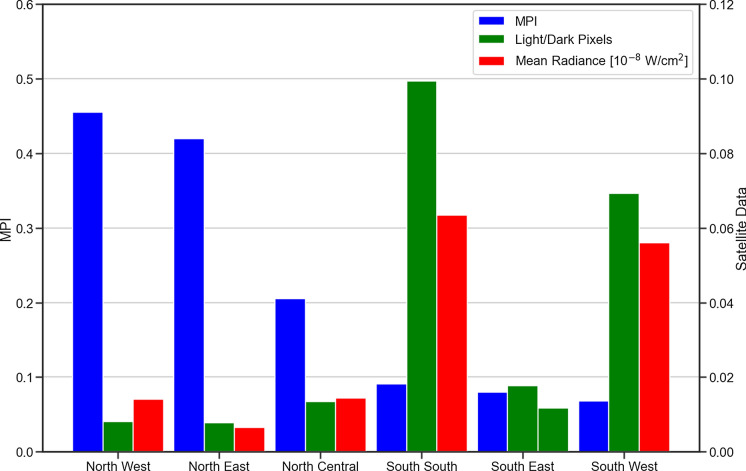
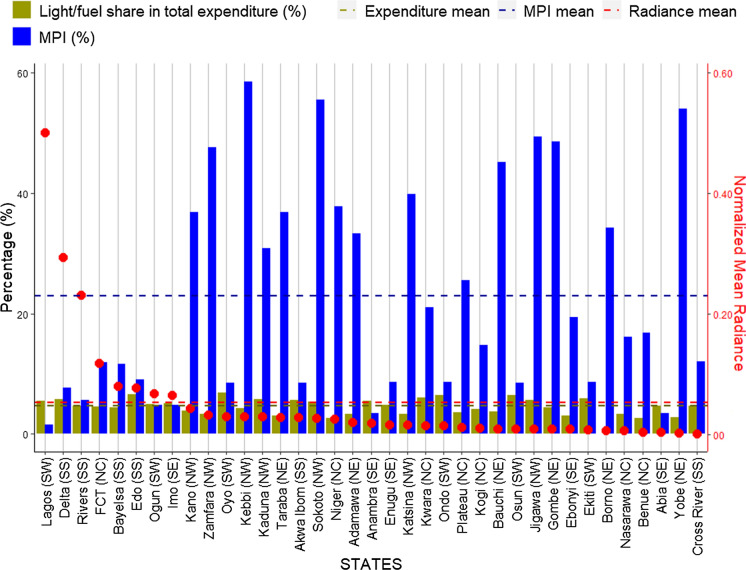
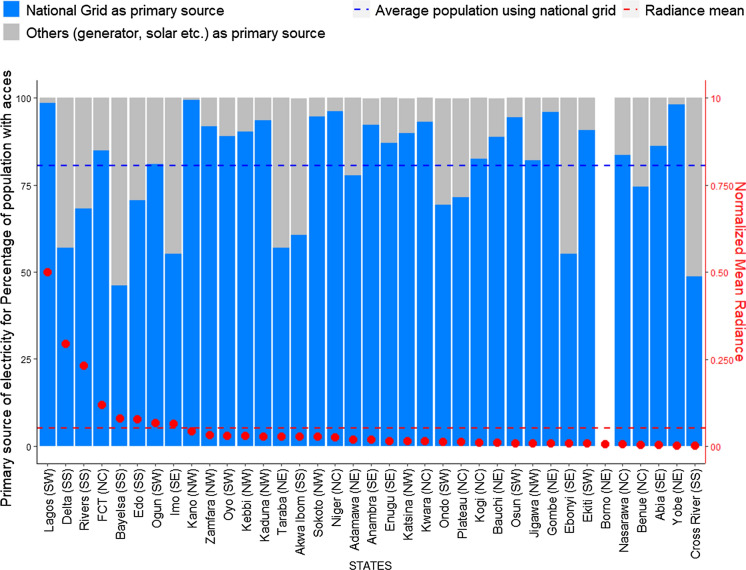
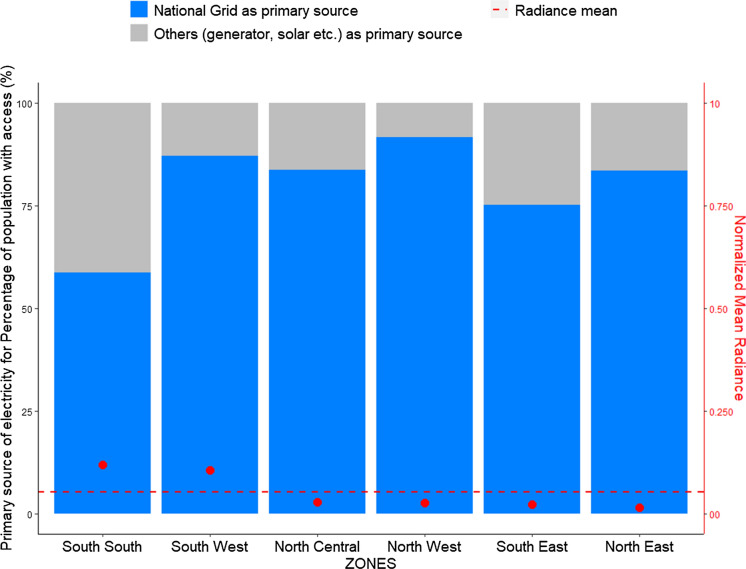
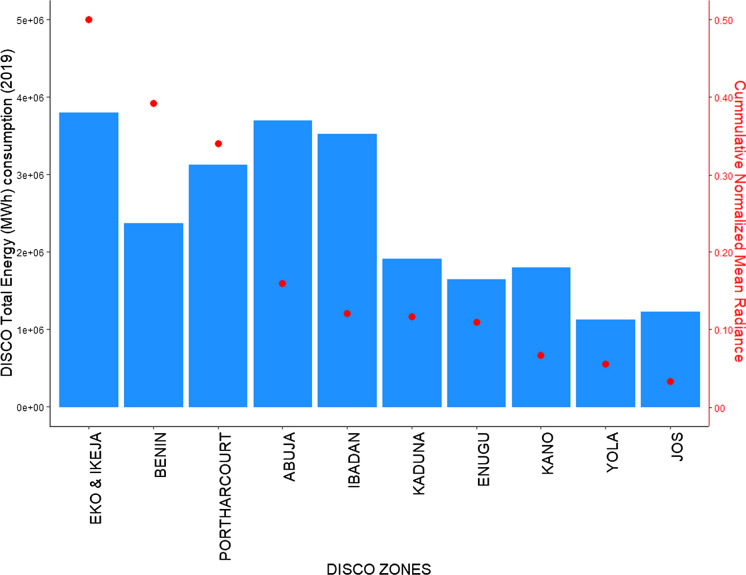
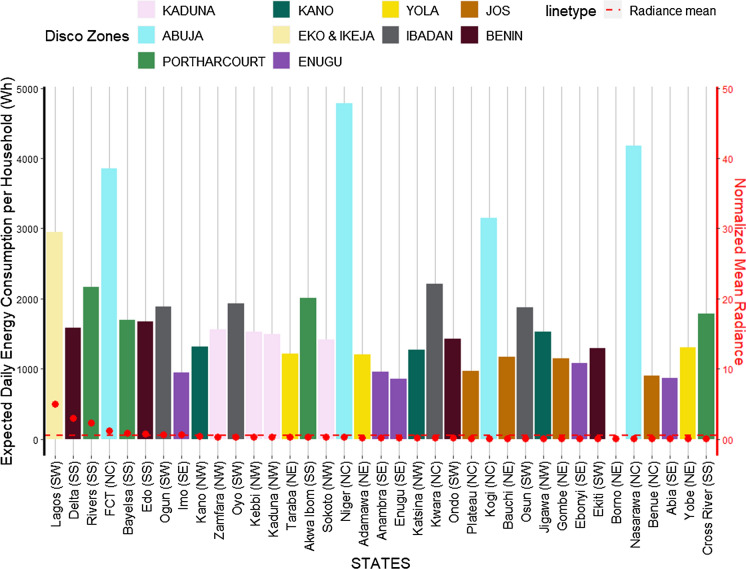
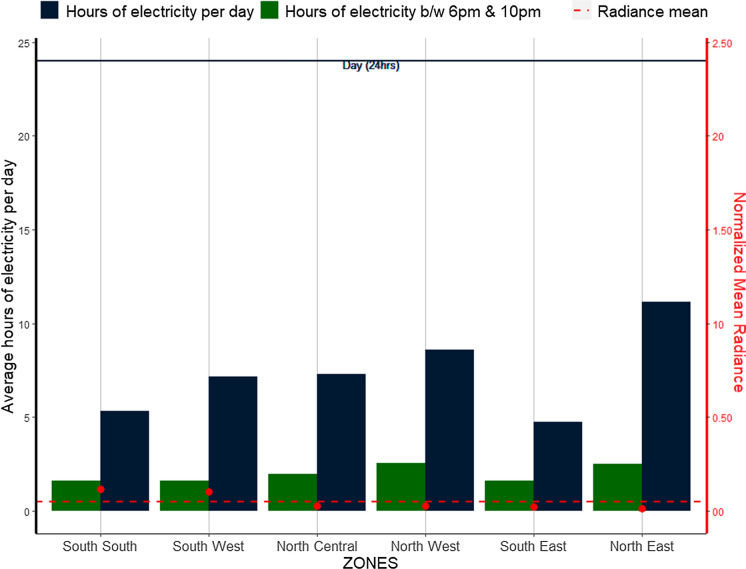
This paper is focussed on employing satellite night lights (SNLs) to investigate access to electricity across the geographical regions in Nigeria. Specifically, we explore how SNLs interact with human and socioeconomic development indicators (population, poverty, and household consumption) to demonstrate the implications of slow and/or delayed progress in closing the electricity access gap in Nigeria. Our findings suggest that minimal progress has been made and there remains significant evidence of disproportionate spread of electricity across the country with most of the electricity visibility concentrated in the Southern regions, state capitals and industrial centres. Crucially, policy challenges and trade offs emerge. On one hand, is the need to address the long-standing issue of stranded and underutilised assets around power generation, transmission, and distribution and how these balance (or not) against additional and new capacity to enable sufficient, reliable and sustained electricity supply. On the other hand, is the challenge of ensuring that closing the access to electricity gap in Nigeria is done in a way that is just, fair, and equitable, with no part of society becoming worse-off or excluded.
Keywords: Electricity access; Satellite Night lights (SNLs); Satellite imagery; Sustainable development tracking.
© The Author(s) 2022.
Conflict of interest statement
Conflict of interestsThere are no relevant financial or non-financial competing interests to report.
Figures


References
-
- Adenikinju, A. F. (2003). Electric infrastructure failures in Nigeria: A survey-based analysis of the costs and adjustment responses. Energy Policy,31(14), 1519–1530. - DOI
-
- Alkire, S., Conconi, A., Robles, G., & Seth, S. (2015). Multidimensional Poverty Index, Winter 2014/2015: Brief Methodological Note and Results [OPHI Briefing 27, January]. University of Oxford.
-
- Alkire, S., Kanagaratnam, U., & Suppa, N. (2020). The Global Multidimensional Poverty Index (MPI) 2020 (Oxford Poverty and Human Development Initiative) [OPHI MPI Methodological Notes 49]. University of Oxford.
-
- Amaral, S., Câmara, G., Monteiro, A. M. V., Quintanilha, J. A., & Elvidge, C. D. (2005). Estimating population and energy consumption in Brazilian Amazonia using DMSP night-time satellite data. Computers, Environment and Urban Systems,29(2), 179–195. 10.1016/j.compenvurbsys.2003.09.004 - DOI
-
- Andries, A., Morse, S., Murphy, R. J., Lynch, J., & Woolliams, E. R. (2022). Using data from earth observation to support sustainable development indicators: An analysis of the literature and challenges for the future. Sustainability,14(3), 1191. - DOI
LinkOut - more resources
Full Text Sources
Miscellaneous