

Arginine Regulates Zygotic Genome Activation in Porcine Embryos Under Nutrition Restriction
- PMID: 35812864
- PMCID: PMC9260689
- DOI: 10.3389/fvets.2022.921406
Arginine Regulates Zygotic Genome Activation in Porcine Embryos Under Nutrition Restriction
Abstract
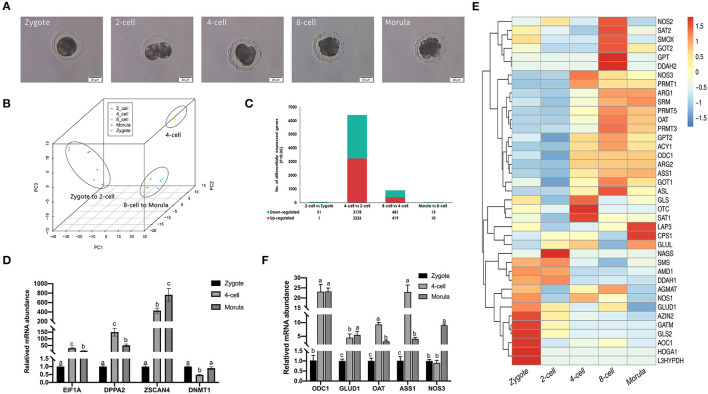
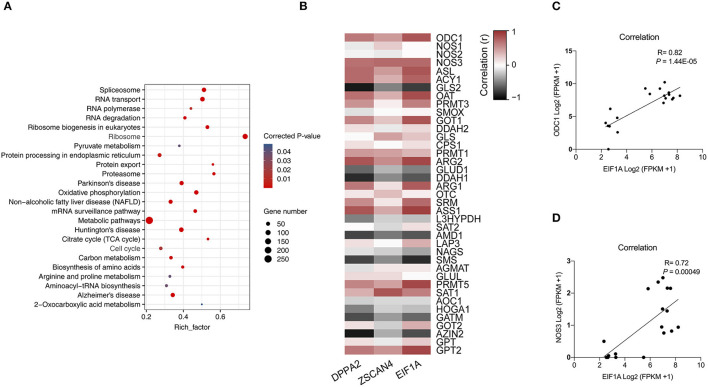
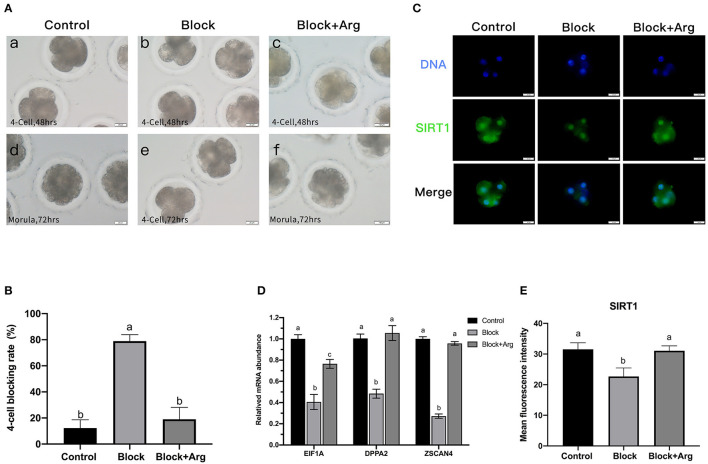
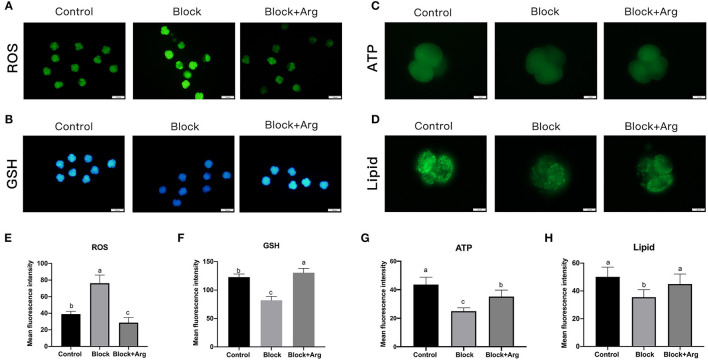
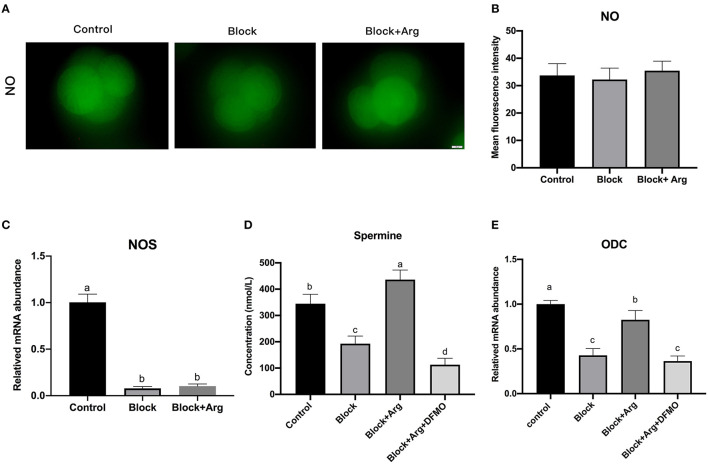
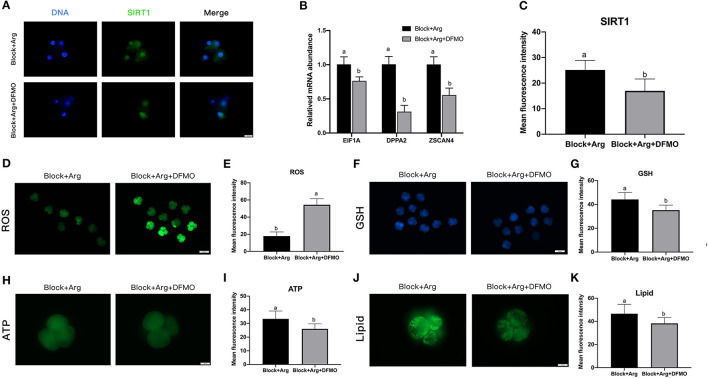
Arginine has a positive effect on pre-implantation development in pigs. However, the exact mechanism by which arginine promotes embryonic development is undefined. Here, single-cell RNA sequencing technology was applied to porcine in vivo pre-implantation embryos from the zygote to morula stage, it was found that that the expression of arginine metabolism-related genes clearly changed from the 2-cell stage to the 4-cell stage, when zygotic genome activation (ZGA) occurs in porcine embryos. Further analysis showed that arginine metabolism-related genes are significantly correlated with key ZGA genes. To determine the function of arginine in porcine embryos during ZGA, the in vitro fertilization embryos were cultured in PZM-3 medium (0.12 mM arginine, Control group), a modified PZM-3 medium (0 mM arginine, Block group) and a modified PZM-3 medium supplemented with arginine (0.12 mM arginine, Block + Arg group). The results showed that the 4-cell arrest rate was significantly increased in the Block group compared to the Control group (P < 0.05). The 4-cell arrest rate in the Block + Arg group was significantly decreased than that in the Block group (P < 0.05). Meanwhile, the expression of ZGA marker genes and SIRT1 protein in 4-cell embryos was significantly decreased in the Block group compared to the Control group, and their expression was significantly increased in the Block + Arg group. In addition, we observed that the glutathione (GSH), ATP levels, and lipid droplet contents were significantly increased, and the reactive oxygen species (ROS) level was decreased in the Block + Arg group compared to the Block group. Compared with Control group, spermine content in culture medium and the mRNA expression of ornithine decarboxylase1 (ODC1) of embryos in the Block group were significantly decreased (P < 0.05), and those in the Block + Arg group were significantly increased compared with the Block group (P < 0.05). Moreover, when difluoromethylornithine (an inhibitor of ODC1) was added to the modified PZM-3 medium supplemented with arginine, the effect of arginine on ZGA was inhibited. In summary, our findings demonstrated that arginine may regulate ZGA under nutrition restriction in porcine embryos by promoting polyamine synthesis.
Keywords: arginine; embryonic development; energy metabolism; oxidative stress; polyamine; porcine; zygotic genome activation.
Copyright © 2022 Zhang, Zheng, Kuang, Yang, Jiang, Wang, Zhao, Han and Che.
Conflict of interest statement
The authors declare that the research was conducted in the absence of any commercial or financial relationships that could be construed as a potential conflict of interest.
Figures
Similar articles
-
Transcriptome analysis of the effects of high temperature on zygotic genome activation in porcine embryos.Sci Rep. 2024 Sep 19;14(1):21849. doi: 10.1038/s41598-024-73166-5. Sci Rep. 2024. PMID: 39300156 Free PMC article.
-
Effects of pyruvate on early embryonic development and zygotic genome activation in pigs.Theriogenology. 2022 Sep 1;189:77-85. doi: 10.1016/j.theriogenology.2022.06.013. Epub 2022 Jun 14. Theriogenology. 2022. PMID: 35732099
-
Profiling the transcriptomic signatures and identifying the patterns of zygotic genome activation - a comparative analysis between early porcine embryos and their counterparts in other three mammalian species.BMC Genomics. 2022 Nov 24;23(1):772. doi: 10.1186/s12864-022-09015-4. BMC Genomics. 2022. PMID: 36434523 Free PMC article.
-
Zygotic Genome Activation Revisited: Looking Through the Expression and Function of Zscan4.Curr Top Dev Biol. 2016;120:103-24. doi: 10.1016/bs.ctdb.2016.04.004. Epub 2016 May 31. Curr Top Dev Biol. 2016. PMID: 27475850 Review.
-
Endogenous Retroviruses Function as Gene Expression Regulatory Elements During Mammalian Pre-implantation Embryo Development.Int J Mol Sci. 2019 Feb 12;20(3):790. doi: 10.3390/ijms20030790. Int J Mol Sci. 2019. PMID: 30759824 Free PMC article. Review.
Cited by
-
Sperm-Derived CircRNA-1572 Regulates Embryogenesis and Zygotic Genome Activation by Targeting CCNB2 via Bta-miR-2478-L-2.Adv Sci (Weinh). 2025 May;12(18):e2414325. doi: 10.1002/advs.202414325. Epub 2025 Mar 17. Adv Sci (Weinh). 2025. PMID: 40091686 Free PMC article.
-
Assessing the influence of distinct culture media on human pre-implantation development using single-embryo transcriptomics.Front Cell Dev Biol. 2023 Jun 26;11:1155634. doi: 10.3389/fcell.2023.1155634. eCollection 2023. Front Cell Dev Biol. 2023. PMID: 37435029 Free PMC article.
-
LncRNA affects epigenetic reprogramming of porcine embryo development by regulating global epigenetic modification and the downstream gene SIN3A.Front Physiol. 2022 Sep 16;13:971965. doi: 10.3389/fphys.2022.971965. eCollection 2022. Front Physiol. 2022. PMID: 36187791 Free PMC article.
-
IDH2 and GLUD1 depletion arrests embryonic development through an H4K20me3 epigenetic barrier in porcine parthenogenetic embryos.Zool Res. 2024 Nov 18;45(6):1175-1187. doi: 10.24272/j.issn.2095-8137.2024.219. Zool Res. 2024. PMID: 39318125 Free PMC article.
-
Transcriptome analysis of the effects of high temperature on zygotic genome activation in porcine embryos.Sci Rep. 2024 Sep 19;14(1):21849. doi: 10.1038/s41598-024-73166-5. Sci Rep. 2024. PMID: 39300156 Free PMC article.
References
-
- Gwatkin RB. Nutritional requirements for post-blastocyst development in the mouse. Amino acids and protein in the uterus during implantation. Int J Fertil. (1969) 14:101–5. - PubMed
LinkOut - more resources
Full Text Sources
Research Materials