

Integrated Analysis of Transcriptome mRNA and miRNA Profiles Reveals Self-Protective Mechanism of Bovine MECs Induced by LPS
- PMID: 35812870
- PMCID: PMC9260119
- DOI: 10.3389/fvets.2022.890043
Integrated Analysis of Transcriptome mRNA and miRNA Profiles Reveals Self-Protective Mechanism of Bovine MECs Induced by LPS
Abstract
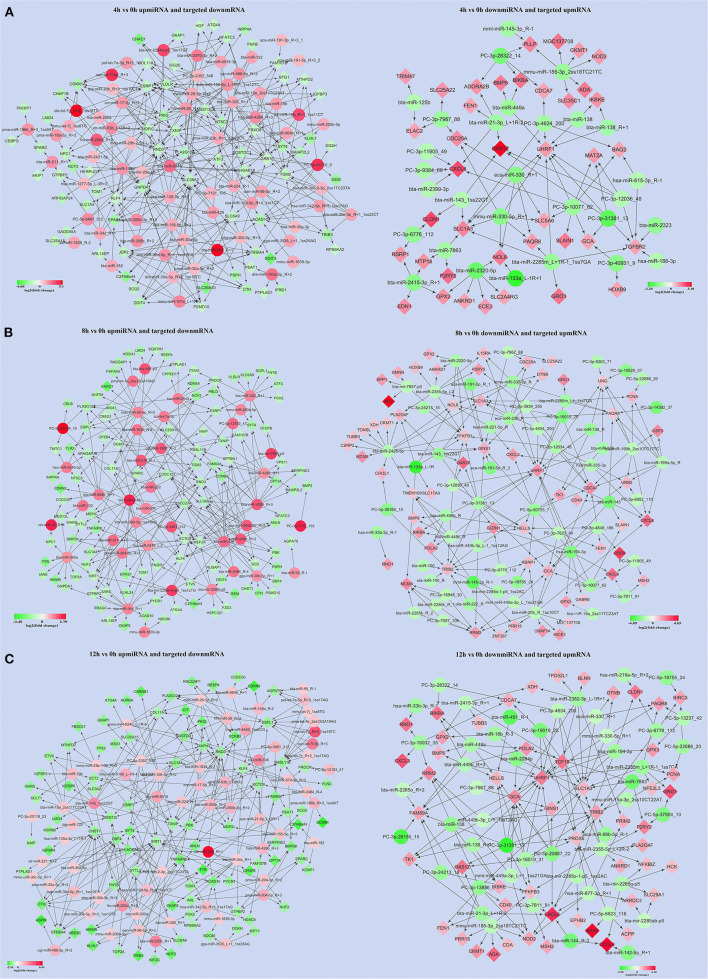
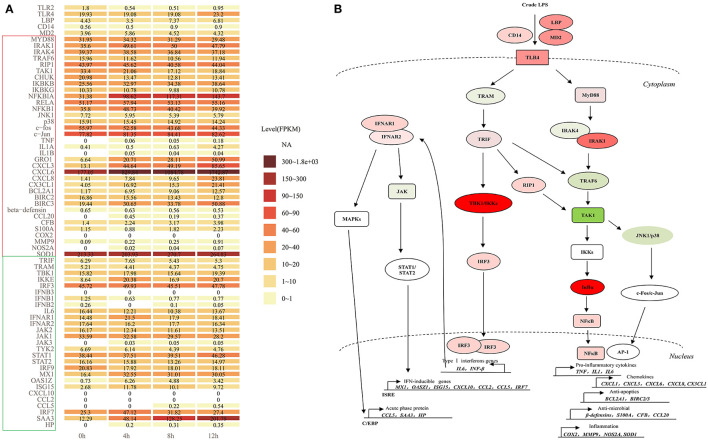
Many studies have investigated the molecular crosstalk between mastitis-pathogens and cows by either miRNA or mRNA profiles. Here, we employed both miRNA and mRNA profiles to understand the mechanisms of the response of bovine mammary epithelial cells (bMECs) to lipopolysaccharide (LPS) by RNA-Seq. The total expression level of miRNAs increased while mRNAs reduced after LPS treatment. About 41 differentially expressed mRNAs and 45 differentially expressed miRNAs involved in inflammation were screened out. We found the NFκB-dependent chemokine, CXCL1, CXCL3, CXCL6, IL8, and CX3CL1 to be strongly induced. The anti-apoptosis was active because BCL2A1 and BIRC3 significantly increased with a higher expression. The effects of anti-microbe and inflammation were weakly activated because TNF, IL1, CCL20, CFB, S100A, MMP9, and NOS2A significantly increased but with a low expression, IL6 and β-defensin decreased. These activities were supervised by the NFKBIA to avoid excessive damage to bMECs. The bta-let-7a-5p, bta-miR-30a-5p, bta-miR-125b, and bta-miR-100 were essential to regulate infection process in bMECs after LPS induction. Moreover, the lactation potential of bMECs was undermined due to significantly downregulated SOSTDC1, WNT7B, MSX1, and bta-miR-2425-5p. In summary, bMECs may not be good at going head-to-head with the pathogens; they seem to be mainly charged with sending out signals for help and anti-apoptosis for maintaining lives after LPS induction.
Keywords: LPS; bMEC; mRNA profile; mastitis; miRNA profile; self-protection.
Copyright © 2022 Chen, Liu, Li, Wang, Tian and Zhang.
Conflict of interest statement
The authors declare that the research was conducted in the absence of any commercial or financial relationships that could be construed as a potential conflict of interest.
Figures


Similar articles
-
Cadmium promotes apoptosis and inflammation via the circ08409/miR-133a/TGFB2 axis in bovine mammary epithelial cells and mouse mammary gland.Ecotoxicol Environ Saf. 2021 Oct 1;222:112477. doi: 10.1016/j.ecoenv.2021.112477. Epub 2021 Jul 5. Ecotoxicol Environ Saf. 2021. PMID: 34237642
-
Transcriptome microRNA profiling of bovine mammary epithelial cells challenged with Escherichia coli or Staphylococcus aureus bacteria reveals pathogen directed microRNA expression profiles.BMC Genomics. 2014 Mar 7;15:181. doi: 10.1186/1471-2164-15-181. BMC Genomics. 2014. PMID: 24606609 Free PMC article.
-
Anti-mastitis SNV identification of NFκB1 in Chinese Holstein cows and the possible anti-inflammation role of NFκB1/p105 in bovine MECs.Acta Biochim Biophys Sin (Shanghai). 2020 Dec 11;52(11):1191-1201. doi: 10.1093/abbs/gmaa118. Acta Biochim Biophys Sin (Shanghai). 2020. PMID: 33253378
-
Differential mRNA Expression Profiling Reveals the Role of MiR-375 in Inflammation of Bovine Mammary Epithelial Cells.Animals (Basel). 2022 Jun 1;12(11):1431. doi: 10.3390/ani12111431. Animals (Basel). 2022. PMID: 35681895 Free PMC article.
-
RNA-seq reveals the role of miR-223 in alleviating inflammation of bovine mammary epithelial cells.Res Vet Sci. 2023 Jun;159:257-266. doi: 10.1016/j.rvsc.2023.04.012. Epub 2023 Apr 19. Res Vet Sci. 2023. PMID: 37192556
Cited by
-
Expression, Regulation, and Function of β-Defensins in the Bovine Mammary Glands: Current Knowledge and Future Perspectives.Animals (Basel). 2023 Oct 31;13(21):3372. doi: 10.3390/ani13213372. Animals (Basel). 2023. PMID: 37958127 Free PMC article. Review.
-
Bta-miR-199a-3p Inhibits LPS-Induced Inflammation in Bovine Mammary Epithelial Cells via the PI3K/AKT/NF-κB Signaling Pathway.Cells. 2022 Nov 7;11(21):3518. doi: 10.3390/cells11213518. Cells. 2022. PMID: 36359915 Free PMC article.
-
The Association between Infant Colic and the Multi-Omic Composition of Human Milk.Biomolecules. 2023 Mar 18;13(3):559. doi: 10.3390/biom13030559. Biomolecules. 2023. PMID: 36979494 Free PMC article.
-
Comparative Analysis of miRNA Expression Profiles of Yak Milk-Derived Exosomes at Different Altitudes.Animals (Basel). 2025 Jan 2;15(1):87. doi: 10.3390/ani15010087. Animals (Basel). 2025. PMID: 39795030 Free PMC article.
-
Multi-omics integration identifies regulatory factors underlying bovine subclinical mastitis.J Anim Sci Biotechnol. 2024 Mar 14;15(1):46. doi: 10.1186/s40104-024-00996-8. J Anim Sci Biotechnol. 2024. PMID: 38481273 Free PMC article.
References
-
- Heimes A, Brodhagen J, Weikard R, Becker D, Meyerholz MM, Petzl W, et al. . Cows selected for divergent mastitis susceptibility display a differential liver transcriptome profile after experimental Staphylococcus aureus mammary gland inoculation. J Dairy Sci. (2020) 103: 6364–73. 10.3168/jds.2019-17612 - DOI - PubMed
LinkOut - more resources
Full Text Sources
Research Materials
Miscellaneous