From Western Asia to the Mediterranean Basin: Diversification of the Widespread Euphorbia nicaeensis Alliance (Euphorbiaceae)
- PMID: 35812903
- PMCID: PMC9262032
- DOI: 10.3389/fpls.2022.815379
From Western Asia to the Mediterranean Basin: Diversification of the Widespread Euphorbia nicaeensis Alliance (Euphorbiaceae)
Abstract
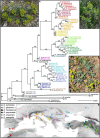
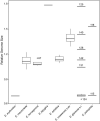
The Mediterranean Basin is an important biodiversity hotspot and one of the richest areas in the world in terms of plant diversity. Its flora parallels in several aspects that of the Eurasian steppes and the adjacent Irano-Turanian floristic region. The Euphorbia nicaeensis alliance spans this immense area from the western Mediterranean to Central Asia. Using an array of complementary methods, ranging from phylogenomic and phylogenetic data through relative genome size (RGS) estimation to morphometry, we explored relationships and biogeographic connections among taxa of this group. We identified the main evolutionary lineages, which mostly correspond to described taxa. However, despite the use of highly resolving Restriction Site Associated DNA (RAD) sequencing data, relationships among the main lineages remain ambiguous. This is likely due to hybridisation, lineage sorting triggered by rapid range expansion, and polyploidisation. The phylogenomic data identified cryptic diversity in the Mediterranean, which is also correlated with RGS and, partly, also, morphological divergence, rendering the description of a new species necessary. Biogeographic analyses suggest that Western Asia is the source area for the colonisation of the Mediterranean by this plant group and highlight the important contribution of the Irano-Turanian region to the high diversity in the Mediterranean Basin. The diversification of the E. nicaeensis alliance in the Mediterranean was triggered by vicariance in isolated Pleistocene refugia, morphological adaptation to divergent ecological conditions, and, to a lesser extent, by polyploidisation.
Keywords: Eurasian steppes; Irano-Turanian region; Mediterranean Basin; RAD sequencing; morphometry; phylogeny; polyploidy; taxonomy.
Copyright © 2022 Stojilkovič, Záveská and Frajman.
Conflict of interest statement
The authors declare that the research was conducted in the absence of any commercial or financial relationships that could be construed as a potential conflict of interest.
Figures


Similar articles
-
Integrative taxonomy reveals cryptic diversity within the Euphorbia nicaeensis alliance (Euphorbiaceae) in the central Balkan Peninsula.Front Plant Sci. 2025 Apr 14;16:1558466. doi: 10.3389/fpls.2025.1558466. eCollection 2025. Front Plant Sci. 2025. PMID: 40297724 Free PMC article.
-
Meeting in Liguria: Hybridisation between Apennine endemic Euphorbia barrelieri and western Mediterranean E. nicaeensis led to the allopolyploid origin of E. ligustica.Mol Phylogenet Evol. 2023 Aug;185:107805. doi: 10.1016/j.ympev.2023.107805. Epub 2023 Apr 29. Mol Phylogenet Evol. 2023. PMID: 37127112
-
Integrating phylogenomics, phylogenetics, morphometrics, relative genome size and ecological niche modelling disentangles the diversification of Eurasian Euphorbia seguieriana s. l. (Euphorbiaceae).Mol Phylogenet Evol. 2019 May;134:238-252. doi: 10.1016/j.ympev.2018.10.046. Epub 2018 Nov 8. Mol Phylogenet Evol. 2019. PMID: 30415023
-
Visions of the past and dreams of the future in the Orient: the Irano-Turanian region from classical botany to evolutionary studies.Biol Rev Camb Philos Soc. 2017 Aug;92(3):1365-1388. doi: 10.1111/brv.12287. Epub 2016 Jun 28. Biol Rev Camb Philos Soc. 2017. PMID: 27349491 Review.
-
How much do we know about the frequency of hybridisation and polyploidy in the Mediterranean region?Plant Biol (Stuttg). 2018 Jan;20 Suppl 1:21-37. doi: 10.1111/plb.12639. Epub 2017 Oct 22. Plant Biol (Stuttg). 2018. PMID: 28963818 Review.
Cited by
-
Evolutionary dynamics of Euphorbia carniolica suggest a complex Plio-Pleistocene history of understorey species of deciduous forest in southeastern Europe.Mol Ecol. 2023 Oct;32(19):5350-5368. doi: 10.1111/mec.17102. Epub 2023 Aug 26. Mol Ecol. 2023. PMID: 37632417 Free PMC article.
-
Integrative taxonomy reveals cryptic diversity within the Euphorbia nicaeensis alliance (Euphorbiaceae) in the central Balkan Peninsula.Front Plant Sci. 2025 Apr 14;16:1558466. doi: 10.3389/fpls.2025.1558466. eCollection 2025. Front Plant Sci. 2025. PMID: 40297724 Free PMC article.
References
-
- Abràmoff M. D., Magalhães P. J., Ram S. J. (2004). Image processing with image. J. Biophotonics 11 36–41.
-
- Barina Z. (2017). Distribution Atlas of Vascular Plants in Albania. Budapest: Hungarian Natural History Museum.
-
- Beck-Mannagetta G. (1920). Flora Bosne, Hercegovine i bivšeg Sandžaka Novog Pazara 2. Glas. Zem. Muz. Bosne Herceg. 32 395–410.
-
- Blondel J., Aronson J. (1999). Biology and Wildlife of the Mediterranean Region. New York, NY: Oxford University Press.
LinkOut - more resources
Full Text Sources

