. 2022 Jun 23:13:904121.
doi: 10.3389/fpls.2022.904121. eCollection 2022.

KLU/CYP78A5, a Cytochrome P450 Monooxygenase Identified via Fox Hunting, Contributes to Cuticle Biosynthesis and Improves Various Abiotic Stress Tolerances

Affiliations

KLU/CYP78A5, a Cytochrome P450 Monooxygenase Identified via Fox Hunting, Contributes to Cuticle Biosynthesis and Improves Various Abiotic Stress Tolerances

Takuma Kajino et al. Front Plant Sci. .

Abstract

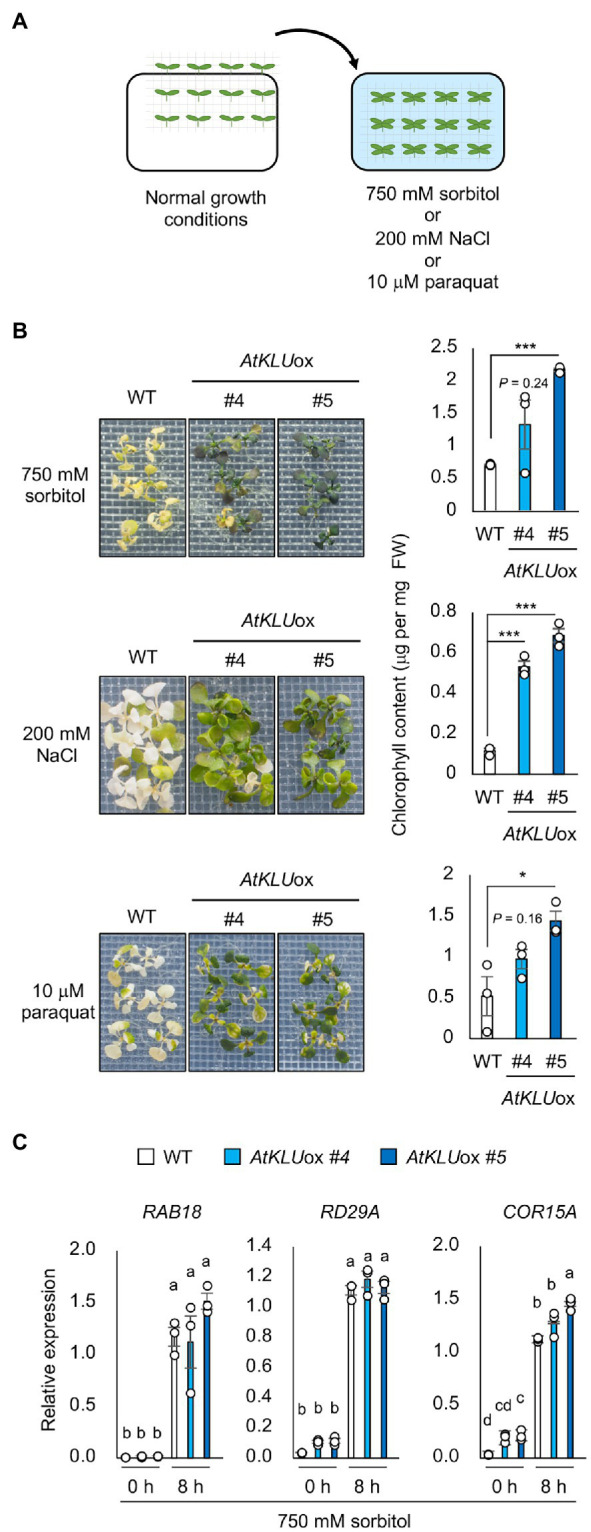
Acquired osmotolerance after salt stress is widespread among Arabidopsis thaliana (Arabidopsis) accessions. Most salt-tolerant accessions exhibit acquired osmotolerance, whereas Col-0 does not. To identify genes that can confer acquired osmotolerance to Col-0 plants, we performed full-length cDNA overexpression (FOX) hunting using full-length cDNAs of halophyte Eutrema salsugineum, a close relative of Arabidopsis. We identified EsCYP78A5 as a gene that can confer acquired osmotolerance to Col-0 wild-type (WT) plants. EsCYP78A5 encodes a cytochrome P450 monooxygenase and the Arabidopsis ortholog is known as KLU. We also demonstrated that transgenic Col-0 plants overexpressing AtKLU (AtKLUox) exhibited acquired osmotolerance. Interestingly, KLU overexpression improved not only acquired osmotolerance but also osmo-shock, salt-shock, oxidative, and heat-stress tolerances. Under normal conditions, the AtKLUox plants showed growth retardation with shiny green leaves. The AtKLUox plants also accumulated higher anthocyanin levels and developed denser cuticular wax than WT plants. Compared to WT plants, the AtKLUox plants accumulated significantly higher levels of cutin monomers and very-long-chain fatty acids, which play an important role in the development of cuticular wax and membrane lipids. Endoplasmic reticulum (ER) stress induced by osmotic or heat stress was reduced in AtKLUox plants compared to WT plants. These findings suggest that KLU is involved in the cuticle biosynthesis, accumulation of cuticular wax, and reduction of ER stress induced by abiotic stresses, leading to the observed abiotic stress tolerances.

Keywords: CYP78A5; cuticle biosynthesis; cuticular wax; heat tolerance; osmotic tolerance.


Conflict of interest statement

The authors declare that the research was conducted in the absence of any commercial or financial relationships that could be construed as a potential conflict of interest.

Figures

Figure 1
Figure 1
Acquired osmotolerance of EsKLUox and AtKLUox plants. (A) Flowchart of the acquired osmotolerance assay. Salt-acclimated 2-week-old seedlings of WT and FOX lines were mesh-transferred to Murashige and FIGURE 1 | Skoog (MS) agar plates containing 750 mM sorbitol for 15 days. (B) Top panel: Acquired osmotolerance of EsKLUox plants. #2 and #4 are independent FOX351 lines. Lower left panel: Relative expression of AtKLU or EsKLU in WT or EsKLUox plants, respectively, under normal conditions; expression levels were determined by quantitative real-time PCR relative to those of Actin2 (mean ± SE, n = 3). The numbers on the bars are the relative expressions. Lower right panel: Chlorophyll content of WT and EsKLUox plants following treatment on NaCl and sorbitol as described in (top). (C) Top panel: Two-week-old WT and AtKLUox plants under normal growth conditions (top row) and on 750 mM sorbitol following treatment on 100 mM NaCl (bottom). #4 and #5 are independent AtKLUox lines. Lower left panel: Relative expression of AtKLU in WT and AtKLUox plants under normal conditions; expression levels were determined by quantitative real-time PCR relative to those of Actin2 (mean ± SE, n = 3). The numbers on the bars are the relative expressions. Lower right panel: Chlorophyll content of WT and AtKLUox plants following treatment on NaCl and sorbitol as described in (top). Differences between WT and EsKLUox or AtKLUox plants were analyzed by Student’s t-test (mean ± SE, n = 3, *P < 0.05, ***P < 0.001).
Figure 2
Figure 2
Osmo-shock, salt-shock, and oxidative tolerance of AtKLUox plants. (A) Flowchart of the osmo-shock, salt-shock, and oxidative tolerance assays. (B) Osmo-shock, salt-shock, and oxidative stress tolerances of AtKLUox plants. Ten-day-old seedlings were mesh-transferred to MS agar plates containing 750 mM sorbitol for 21 days, 200 mM NaCl for 7 days, or 10 μM paraquat (oxidative stress inducer) for 14 days. Right panel: Chlorophyll content of seedlings shown at left. Differences between WT and AtKLUox plants were analyzed by Student’s t-test (mean ± SE, n = 3, *p < 0.05, FIGURE 2 | ***p < 0.001). (C) Expression profiles of osmo-responsive marker genes in WT and AtKLUox plants under normal (0 h) and acquired osmotic stress (100 mM NaCl for 7 days followed by 750 mM sorbitol for 8 h) conditions; expression levels were determined by quantitative real-time PCR relative to those of Actin2. Bars labeled with different letters differ significantly (P < 0.05, one-way ANOVA with post hoc Tukey HSD test, mean ± SE, n = 3).
Figure 3
Figure 3
Heat stress tolerance of AtKLUox plants. (A) Upper left panel: Flowchart of S-heat tolerance assay. Upper middle panel: S-heat tolerance of WT and AtKLUox plants. Ten-day-old seedlings grown at 22°C (normal conditions) were placed at 42°C for 50 min and then grown at 22°C for 5 days. Upper right panel: Chlorophyll content of seedlings shown at left. Lower left panel: Flow of L-heat tolerance assay. Lower middle panel: 10-day-old WT and AtKLUox seedlings grown at 22°C were placed at 37°C for 5 days and then grown at 22°C for 5 days. Lower right panel: Chlorophyll content of seedlings shown in left. Differences between WT and AtKLUox plants were analyzed by Student’s t-test (mean ± SE, n = 3, *P < 0.05, ***P < 0.001). (B) Expression of HSP70, HSP17.6, and HsfA2 in WT and AtKLUox plants under normal (0 h) and heat stress (37°C for 8 h) conditions; expression levels were determined by quantitative real-time PCR relative to those of Actin2. Bars labeled with different letters differ significantly (P < 0.05, one-way ANOVA with post hoc Tukey HSD test, mean ± SE, n = 3).
Figure 4
Figure 4
Epidermal cuticular wax of AtKLUox plants. (A) Four-week-old WT and AtKLUox plants grown in soil under normal conditions. Lower panel: Magnified view of their leaves. (B) Toluidine blue (TB) test. Left panel: Two-week-old WT and AtKLUox plants stained with TB. Right panel: TB extract was examined spectrophotometrically, and the amount of TB was determined by the absorbance at 630 nm (A630). The major peak of absorbance due to FIGURE 4 | plant material (A435) was used for normalization. Relative levels of TB were calculated as the ratio of A630:A435. Differences between WT and AtKLUox plants were analyzed by Student’s t-test (mean ± SE, n = 3, **P < 0.01). (C) Stem surface of WT and AtKLUox #5 observed by scanning electron microscopy. Bars = 100 mm. (D) Water loss from detached WT and AtKLUox leaves. The entire aerial parts of 4-week-old plants grown in soil under normal growth conditions were detached (0 min) and then left under ambient conditions for 60 min, with measurements taken every 10 min. The percentage decrease in fresh weight was used as the percentage water loss. Bars labeled with different letters differ significantly (P < 0.05, one-way ANOVA with post hoc Tukey HSD test, mean ± SE, n = 3).
Figure 5
Figure 5
Cuticular wax content and composition of 4-week-old WT and AtKLUox seedlings. (A) Total wax content of WT and AtKLUox plants. (B) Fatty acid (C16–C32) contents in WT and AtKLUox plants. (C) Identified waxes (alkanes, ketones, aldehydes, and primary alcohols) in WT and AtKLUox plants. Data represent means ± SE, n = 6. Within each compound type and chain length, values marked with the same letter are not significantly different based on one-way ANOVA and Tukey’s test, P < 0.05.
Figure 6
Figure 6
Cutin monomer content and composition of 4-week-old WT and AtKLUox seedlings. (A) Total cutin monomer content of WT and AtKLUox plants. (B) Identified cutin monomers (coumaric acid, ferulic acid, fatty acids, dicarboxylic acids, 16, 10 dihydroxy fatty acid, ω-hydroxy fatty acids, and 2-hydroxy fatty acids) in WT and AtKLUox plants. The C16 ~ 26 labels on the x axis indicate chain length. Data represent means ± SE, n = 6. Within each compound type and chain length, values marked with the same letter are not significantly different based on one-way ANOVA and Tukey’s test, P < 0.05.
Figure 7
Figure 7
ER stress in AtKLUox plants under osmotic or heat stress. (A) Transcript levels of bZIP60, SAR1A, and SEC31A in WT and AtKLUox plants under normal (0 day) and osmotic stress condition (750 mM sorbitol for 7 days). (B) Transcript levels of bZIP60, SAR1A, and SEC31A in WT and AtKLUox plants under normal (0 day) and heat stress (37°C for 8 h) conditions. Expression levels were determined by quantitative real-time PCR relative to FIGURE 7 | those of Actin2. Bars labeled with different letters differ significantly (P < 0.05, one-way ANOVA with post hoc Tukey HSD test, mean ± SE, n = 3). (C) Trypan blue staining of leaves of WT or AtKLUox plants under normal, osmotic stress (750 mM sorbitol for 7 days), and heat stress (37°C for 5 days) conditions.
Figure 8
Figure 8
Protein structure prediction of AtKLU. (A) The predicted structure of CYP78A5 colored according to the pLDDT values [blue (high) to yellow (low)]. The internal cavity of CYP78A5 is shown as a gray surface. (B) The crystal structure of CYP97C1 (green) with heme and octylthioglucoside (OTG; magenta). The location of retinal (magenta) was modeled by superposing the CYP97A3-retinal complex (PDB ID: 6L8J) onto CYP97C1 (PDB ID: 6L8H). The putative lutein-binding cavity in CYP97C1 is shown as a gray surface. (C) Superposition of CYP78A5 and CYP97C1. (D) The predicted active site of CYP78A5 [enlarged from (C)]. The residues involved in constructing the internal cavity are shown as line models. The location of heme, OTG, and retinal (magenta) were modeled by superposing CYP97C1 onto the CYP78A5 model. (E) Phylogenetic tree created from amino acid sequences of CYP-74, -77, -78, and -97 with root mean square deviation (RMSD) values.

Similar articles

Cited by

References

    1. Aharoni A., Dixit S., Jetter R., Thoenes E., van Arkel G., Pereira A. (2004). The SHINE Clade of AP2 domain transcription factors activates wax biosynthesis, alters cuticle properties, and confers drought tolerance when overexpressed in Arabidopsis. Plant Cell 16, 2463–2480. doi: 10.1105/tpc.104.022897 - DOI - PMC - PubMed
    1. Anastasiou E., Kenz S., Gerstung M., MacLean D., Timmer J., Fleck C., et al. . (2007). Control of plant organ size by KLUH/CYP78A5-dependent intercellular signaling. Dev. Cell 13, 843–856. doi: 10.1016/j.devcel.2007.10.001 - DOI - PubMed
    1. Ariga H., Katori T., Tsuchimatsu T., Hirase T., Tajima Y., Parker J. E., et al. . (2017). NLR locus-mediated trade-off between abiotic and biotic stress adaptation in Arabidopsis. Nat. Plants 3:17072. doi: 10.1038/nplants.2017.72 - DOI - PubMed
    1. Ariga H., Tanaka T., Ono H., Sakata Y., Hayashi T., Taji T. (2015). CSP41b, a protein identified via FOX hunting using E. salsugineum cDNAs, improves heat and salinity stress tolerance in transgenic A. thaliana. Biochem. Biophys. Res. Commun. 464, 318–323. doi: 10.1016/j.bbrc.2015.06.151 - DOI - PubMed
    1. Batsale M., Bahammou D., Fouillen L., Mongrand S., Joubès J., Domergue F. (2021). Biosynthesis and functions of very-long-chain fatty acids in the responses of plants to abiotic and biotic stresses. Cells 10:284. doi: 10.3390/cells10061284 - DOI - PMC - PubMed

LinkOut - more resources