. 2022 Jun 23:13:889726.
doi: 10.3389/fpls.2022.889726. eCollection 2022.

Transcriptome and Metabonomics Combined Analysis Revealed the Defense Mechanism Involved in Hydrogen-Rich Water-Regulated Cold Stress Response of Tetrastigma hemsleyanum

Affiliations

Transcriptome and Metabonomics Combined Analysis Revealed the Defense Mechanism Involved in Hydrogen-Rich Water-Regulated Cold Stress Response of Tetrastigma hemsleyanum

Yuxiu Liu et al. Front Plant Sci. .

Abstract

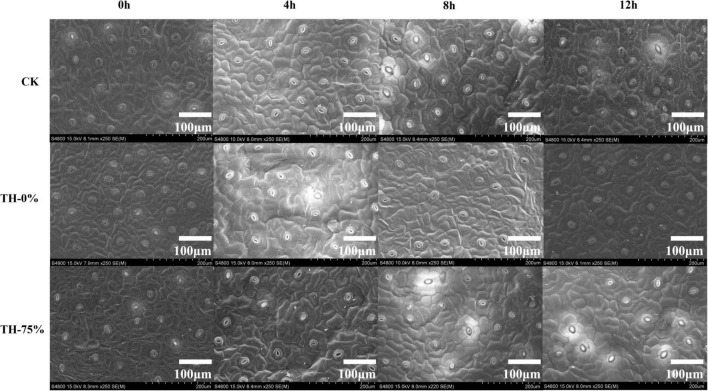
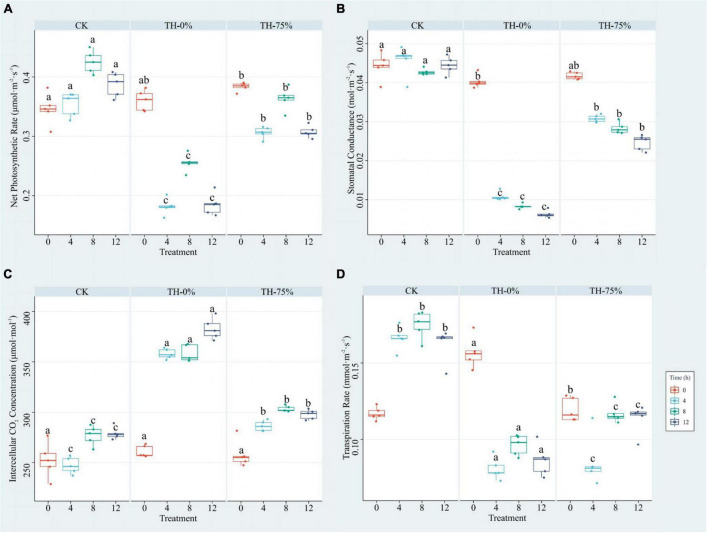
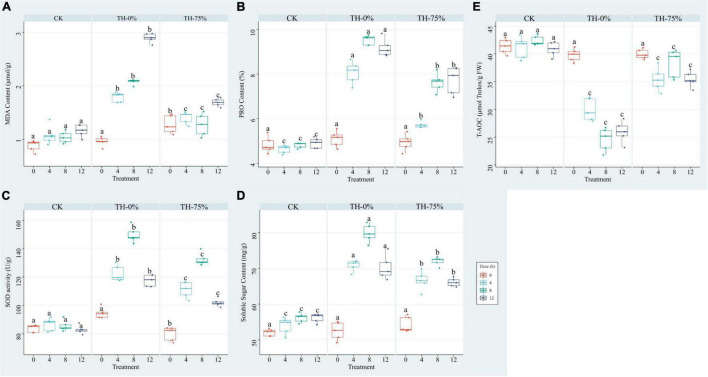
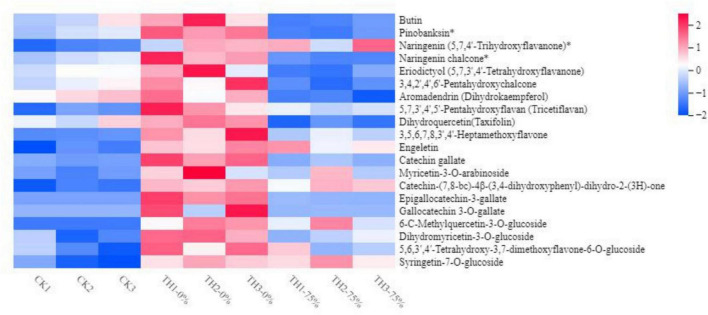
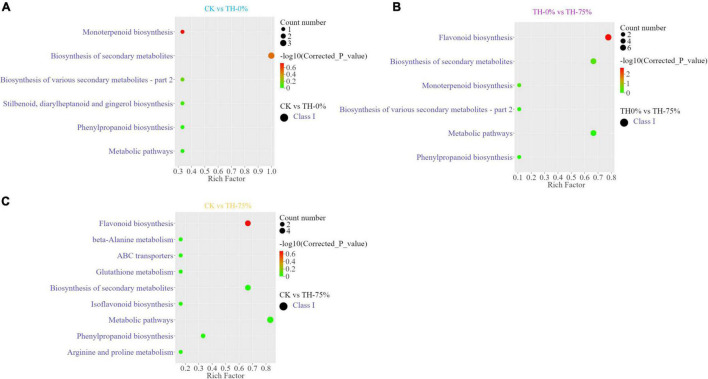
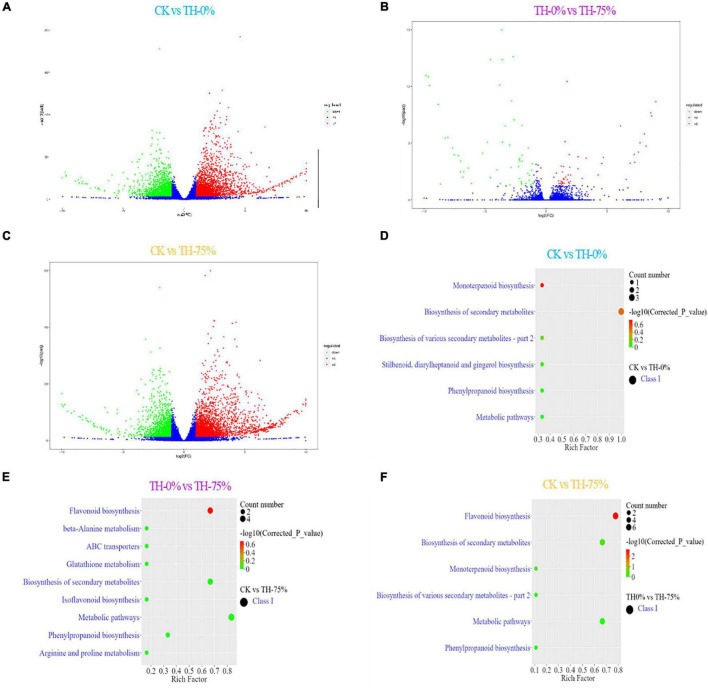
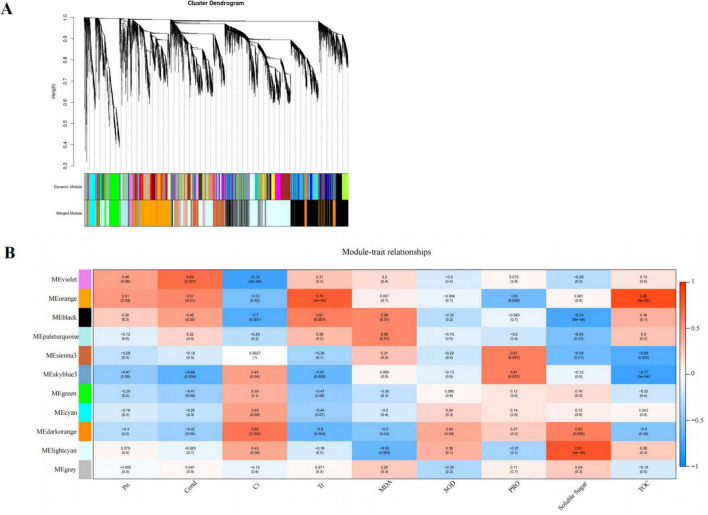
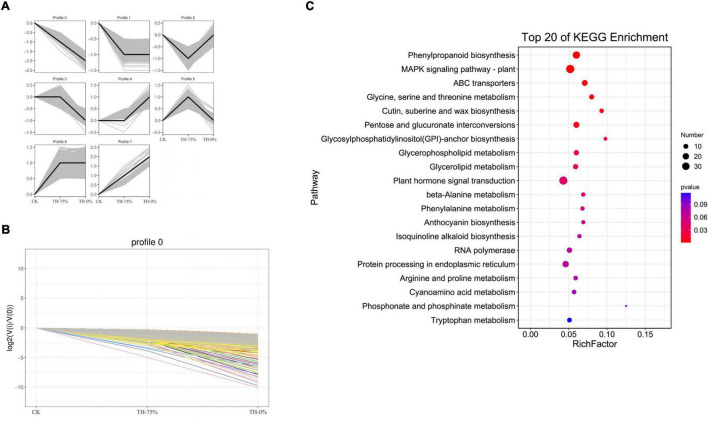
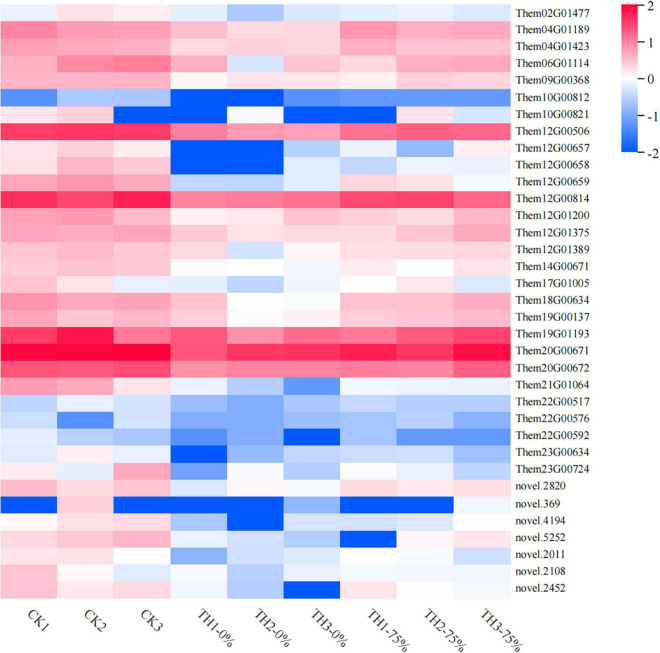
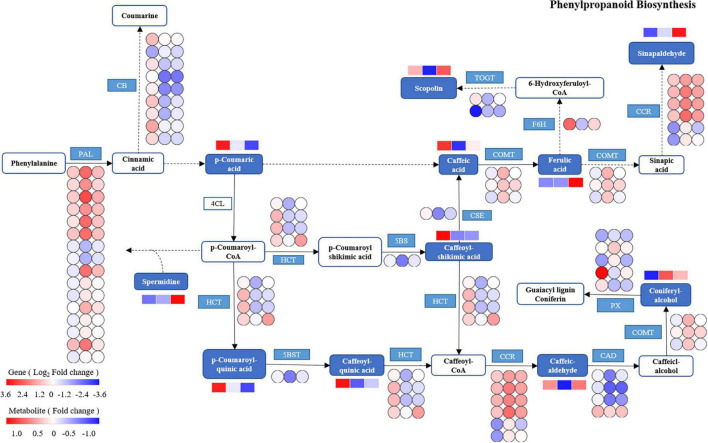
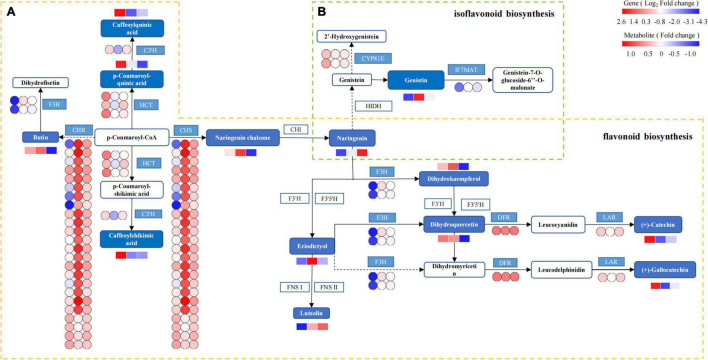
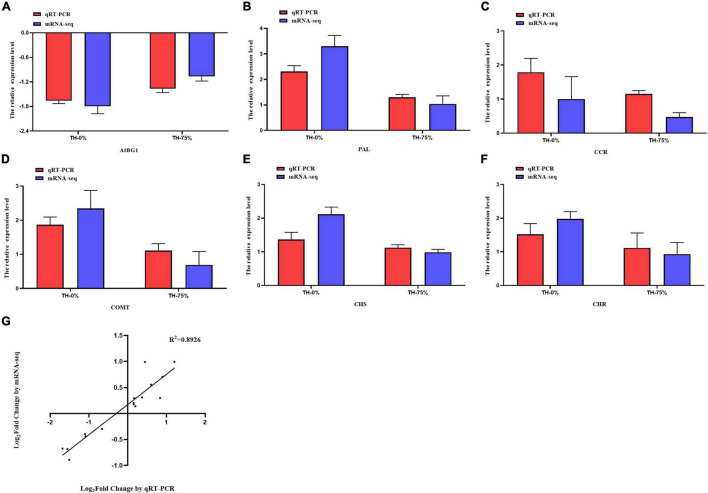
The poor resistance to cold stress conditions has become the bottleneck problem in Tetrastigma hemsleyanum (T. hemsleyanum) planting industry. Exogenous hydrogen (H2) plays an important role in improving stress resistance in plants. However, the key factors and regulatory network of plants in response to hydrogen-rich water (HRW) treatment under environmental stress are not clear. Here, we conducted integrative analyses of metabolome and transcriptome profiles to reveal the defense mechanism involved in the HRW-regulated cold stress response of T. hemsleyanum. The application of 75% HRW could alleviate stress damage by decreasing stomatal apparatus density and significantly increasing photosynthetic efficiency and mitigating physiological indexes of resistance, such as Pn, Cond, MDA, SOD, etc., which were changed by cold stress conditions. A total of 7,883 DEGs and 439 DEMs were identified. DEGs were the most relevant to phenylpropanoid, isoflavonoid, monoterpenoid, and flavonoid biosynthesis pathways. Using gene co-expression analysis (WGCNA), we identified one gene module that showed a strong correlation between total antioxidant capacity and transpiration rate. Trend analysis indicated that the phenylpropanoid biosynthesis pathway played a major role in the transcription and metabolism process of HRW treatment under cold stress. Based on the integrated analysis of genes and metabolites, the results showed cold stress upregulated the expression of PAL, CHS, COMT, CCR, AtBG1, etc., resulting in the accumulation of coniferyl alcohol and eriodictyol contents in T. hemsleyanum under cold stress, but the 75% HRW treatment could attenuate the enhancement. The study not only identified the main strategy of HRW protection against cold stress but also provided candidate genes for flavonoid biosynthesis, so as to better improve cold tolerance through molecular breeding techniques.

Keywords: RNA-seq; Tetrastigma hemsleyanum; cold stress; hydrogen-rich water; metabolite profiling; physiological and biochemical.


Conflict of interest statement

The authors declare that the research was conducted in the absence of any commercial or financial relationships that could be construed as a potential conflict of interest.

Figures

FIGURE 1
FIGURE 1
The scanning electron microscopy of leaf surfaces in CK, TH-0%, and TH-75% at 0, 4, 8, and 12 h.
FIGURE 2
FIGURE 2
Pn (A), Cond (B), Ci (C), and Tr (D) of T. hemsleyanum in CK, TH-0%, and TH-75% groups at 0, 4, 8, and 12 h. Data are mean ± SE (n = 5). Data labeled with different lowercase letters are significantly different at P < 0.05 level.
FIGURE 3
FIGURE 3
MDA (A), PRO (B), SOD (C), SS (D), and T-AOC (E) of T. hemsleyanum in CK, TH-0%, and TH-75% groups at 0, 4, 8, and 12 h. Data are mean ± SE (n = 5). Data labeled with different lowercase letters are significantly different at P < 0.05 level.
FIGURE 4
FIGURE 4
Heat map visualization of metabolites. The content of each flavonoid metabolite was normalized. Each sample is visualized in a single column, and each metabolite is represented by a single row. Red indicates high abundance, whereas low relative metabolites are shown in blue (the color key scale is provided on the right of the heatmap). The symbol * indicates that isomers of the metabolite, but specific isomers cannot be distinguished.
FIGURE 5
FIGURE 5
Differentially accumulated metabolites (DAMs) and KEGG enrichment analysis in CK vs TH-0% (A), TH-0% vs TH-75% (B), and CK vs TH-75% (C) groups.
FIGURE 6
FIGURE 6
Bar plot showing numbers of DEGs in CK vs TH-0% (A), TH-0% vs TH-75% (B), and CK vs TH-75% (C) groups. Bubble plots showing significantly enriched KEGG pathways (P < 0.05). Top 10 pathways according to enrichment factor from DEGs in CK vs TH-0% (D), TH-0% vs TH-75% (E), and CK vs TH-75% (F) groups. The horizontal axis represents the differential expression multiple, and the vertical axis represents the degree of difference in gene meaning. The red dots indicate the upregulated expressed genes (Log2FC ≥ 2), the green dots indicate the downregulated expressed genes (Log2FC ≤ 0.5), and the blue dots indicate the non-significantly differentially expressed genes (0.5 < Log2FC < 2).
FIGURE 7
FIGURE 7
Cluster hierarchy of 24 co-expression modules divided by co-expression network (A); Identification of pathway modules related to photosynthesis and cold tolerance indexes (B). The correlation coefficient between the module and sample is described by the color of each cell at the row-column intersection. Red and blue colors indicate the positive and negative correlations, respectively.
FIGURE 8
FIGURE 8
Trend analysis of differentially expressed genes (A), changes in the gene expression level of profile 0 (B), and the pathway of genes in profile 0 can be annotated in the KEGG database (C). From this figure, we can intuitively see the expression changes of genes belonging to this trend, as well as the tightness of aggregation. Each line in the figure represents a gene, and the abscissa is the sample group and the ordinate is the expression change [log2 (Vi/V0)].
FIGURE 9
FIGURE 9
Heat map visualization of the 35 genes in flavonoid metabolism-related pathways selected from profile 0. The color bar represents the log (fold change) values.
FIGURE 10
FIGURE 10
The DEGs and DEMs involved in the phenylpropanoid biosynthesis pathway in response to cold stress. The blue pattern represents the metabolites or genes that changed under CK, TH-0%, and TH-75% groups. The rectangle is divided into three equal parts (the left of the rectangle represents DEGs or DEMs in CK, the middle of the rectangle represents DEGs or DEMs in TH-0%, and the right of the rectangle represents DEGs or DEMs in TH-75%). The color in the rectangle indicates that the genes or metabolites were regulated (red indicates upregulation and blue indicates downregulation). AtBG1: beta-glucosidase; PAL: phenylalanine ammonia-lyase; CCR: cinnamoyl-CoA reductase; PX: peroxidase; HCT: shikimate O-hydroxy cinnamoyl transferase; TOGT1: scopoletin glucosyltransferase; F6H: feruloyl-CoA 6-hydroxylase; CSE: caffeoyl shikimate esterase; 5BST: 5-O-(4-coumaroyl)-D-quinate 3′-monooxygenase; CAD: cinnamyl-alcohol dehydrogenase; and COMT: caffeic acid 3-O-methyltransferase.
FIGURE 11
FIGURE 11
The DEGs and DEMs involved in flavonoid and isoflavonoid biosynthesis in response to cold stress. The flavonoid biosynthesis process is given within the yellow dotted box (A), and the isoflavonoid biosynthesis is within the green dotted box (B). The blue pattern represents the annotated metabolites or genes. The rectangle is divided into three equal parts (the left of the rectangle represents DEGs or DEMs in CK, the middle of the rectangle represents DEGs or DEMs in TH-0%, and the right of the rectangle represents DEGs or DEMs in TH-75%). The color in the rectangle represents that the genes or metabolites are regulated under cold stress (red indicates upregulation and blue indicates downregulation). CHS: chalcone synthase; CHR: chalcone reductase; HCT: shikimate O-hydroxycinnamoyl transferase; C3′H: 5-O-(4-coumaroyl)-D-quinate 3′-monooxygenase; LAR: leucoanthocyanidin reductase; F3H: naringenin 3-dioxygenase; DFR: bifunctional dihydroflavonol 4-reductase; IF7MAT: isoflavone 7-O-glucoside-6″-O-malonyltransferase; and CYP81E: isoflavone.
FIGURE 12
FIGURE 12
Expression pattern validation (A–F) and linear dependence relation between the log2 values of the key gene expression ratios obtained from RNA-seq and qRT-PCR (G).

Similar articles

Cited by

References

    1. Buchfink B., Xie C., Huson D. H. (2015). Fast and sensitive protein alignment using DIAMOND. Nat. Methods 12 59–60. 10.15496/publikation-1176 - DOI - PubMed
    1. Cao Z. Y., Duan X. L., Yao P. (2017). Hydrogen gas is involved in auxin-induced lateral root formation by modulating nitric oxide synthesis. Int. J. Mol. Sci. 18:2084. 10.3390/ijms18102084 - DOI - PMC - PubMed
    1. Chen Q. H., Zhao X. Q., Lei D. K., Hu S. B., Shen Z. G., Shen W. B., et al. (2017). Hydrogen-rich water pretreatment alters photosynthetic gas exchange, chlorophyll fluorescence, and antioxidant activities in heat-stressed cucumber leaves. Plant Growth Regul. 83 69–82. 10.1007/s10725-017-0284-1 - DOI
    1. Chialva M., Ghignone S., Novero M., Hozzein W. N., Lanfranco L., Bonfante P. (2020). Tomato RNA-seq data mining reveals the taxonomic and functional diversity of root-associated microbiota. Microorganisms 8:38. 10.3390/microorganisms8010038 - DOI - PMC - PubMed
    1. Dai C., Cui W. T., Pan J. C., Xie Y. J., Wang J., Shen W. B. (2017). Proteomic analysis provides insights into the molecular bases of hydrogen gas-induced cadmium resistance in Medicago sativa. J. Proteomics 152 109–120. 10.1016/j.jprot.2016.10.013 - DOI - PubMed