. 2022 Jun 23:13:917493.
doi: 10.3389/fpls.2022.917493. eCollection 2022.

Multi-Omics Analysis Reveals a Regulatory Network of ZmCCT During Maize Resistance to Gibberella Stalk Rot at the Early Stage

Affiliations

Multi-Omics Analysis Reveals a Regulatory Network of ZmCCT During Maize Resistance to Gibberella Stalk Rot at the Early Stage

Bozeng Tang et al. Front Plant Sci. .

Abstract

Gibberella stalk rot (GSR) caused by Fusarium graminearum is one of the most devastating diseases in maize; however, the regulatory mechanism of resistance to GSR remains largely unknown. We performed a comparative multi-omics analysis to reveal the early-stage resistance of maize to GSR. We inoculated F. graminearum to the roots of susceptible (Y331) and resistant (Y331-ΔTE) near-isogenic lines containing GSR-resistant gene ZmCCT for multi-omics analysis. Transcriptome detected a rapid reaction that confers resistance at 1-3 hpi as pattern-triggered immunity (PTI) response to GSR. Many key properties were involved in GSR resistance, including genes in photoperiod and hormone pathways of salicylic acid and auxin. The activation of programmed cell death-related genes and a number of metabolic pathways at 6 hpi might be important to prevent further colonization. This is consistent with an integrative analysis of transcriptomics and proteomics that resistant-mediated gene expression reprogramming exhibited a dynamic pattern from 3 to 6 hpi. Further metabolomics analysis revealed that the amount of many chemical compounds was altered in pathways associated with the phenylpropanoid biosynthesis and the phenylalanine metabolism, which may play key roles to confer the GSR resistance. Taken together, we generated a valuable resource to interpret the defense mechanism during early GSR resistance.

Keywords: Fusarium graminearum; gibberella stalk rot; maize disease; metabolomics; multi-omics; plant resistance; transcriptomics.


Conflict of interest statement

The authors declare that the research was conducted in the absence of any commercial or financial relationships that could be construed as a potential conflict of interest.

Figures

FIGURE 1
FIGURE 1
Framework of integrative multi-omic analysis of early-stage defense response to GSR in maize. (A) Sketch maps of NILs Y331-ΔTE1 and Y331 at the ZmCCT locus. (B) Expression profiles of ZmCCT in Y331-ΔTE1 and Y331 seedling roots inoculated with Fusarium graminearum at different time points. Data were normalized to Y331 at 0 h post-inoculation (hpi). For each sample, the ZmGAPDH gene was used as the internal control. Error bars present the ±s.d. of three biological replicates. (C) Symptoms of the F. graminearum-inoculated maize seedling roots at 72 hpi. (D) Growth and distribution of GFP-tagged F. graminearum in diseased root tissues of Y331-ΔTE1 and Y331 at different time points. (E) Strategy for multiple omics analysis of ZmCCT-mediated defense response in maize.
FIGURE 2
FIGURE 2
Early-stage resistance to GSR by reprogramming maize transcriptomics. (A) The plot showing the principal component analysis (PCA) of maize transcriptomics from Y331-ΔTE and Y331 at four different time points. Normalized reads count was used. (B) A Venn diagram showing the numbers of differentially expressed genes (log2| FC| > 1, padj < 0.05) detected in RNA-seq at 0, 1, 3, and 6 hpi. (C) The KEGG pathway enrichment analysis using DEGs detected in RNA-seq. (D) A heatmap showing relative expression using log2| FC| values from our RNA-seq to demonstrate the expression of ortholog genes between maize and Arabidopsis. The Arabidopsis RNA-seq data were reported as transcriptionally induced genes responding to fungal elicitor (2021, Nature Plant). (E) Alluvial plots of a fraction of a number of differentially expressed genes during infection stages. Each panel shows one time point, and each line represents a different group of DEGs. Red and blue highlight the fractions of DEGs detected at 3 hpi.
FIGURE 3
FIGURE 3
Weighted correlation network analysis (WGCNA) analysis defined nine co-expressed genes as modules during infection stages. (A) The plots showing relative expression as TPM values of hub genes representing nine coexpressed genes modules derived from WGCNA analysis using all samples. (B) A dot plot showing the significance of KEGG pathways enriched by each coexpression module.
FIGURE 4
FIGURE 4
Mapping of differentially expressed genes in maize during different infection stages of Fusarium graminearum. (A) The heatmaps showed detailed relative expression (log2 fold change) of selected genes related to important functions from RNA-seq. Genes were named according to their Arabidopsis or rice orthologs. (B) Relative expression of several putative flowering time-related genes in F. graminearum-infected maize seedling root at different time points. The β-actin gene ZmActin was used as an internal control for normalization. For each gene, the relative enrichment value in Y331-infected seedling root cells at 0 hpi was assigned as 1. Error bars present the ±s.d. of three biological replicates.
FIGURE 5
FIGURE 5
Hormone level changes in Y331-ΔTE and Y331 during infection of Fusarium graminearum. (A) Determination of endogenous maize hormone contents by LC-MS/MS during F. graminearum infection on Y331-ΔTE or Y331 at different time points. SA, salicylic acid; SAG, salicylic acid 2-O-β-glucoside; IAA, indole-3-acetic acid; IAA-Asp, indole-3-acetyl-L-aspartic acid; IAA-Glc, 1-O-indol-3-ylacetylglucose; OxIAA, 2-oxindole-3-acetic acid; IAA-Glu, indole-3-acetyl glutamic acid. (B) Relative expression of hormone signaling pathway-related genes in F. graminearum-infected maize seedling root at different time points. The β-actin gene ZmActin was used as an internal control for normalization. For each gene, the relative enrichment value in Y331-infected seedling root cells at 0 hpi was assigned as 1. Error bars present the ±s.d. of three biological replicates.
FIGURE 6
FIGURE 6
Proteomic analysis revealed a stronger response to infection at the translational level at 6 hpi. (A) Principal component analysis of maize proteomics from Y331-ΔTE and Y331 at different time points. (B) Barplot showing numbers of DEPs as upregulated and downregulated proteins. (C) A dot plot showing the significance of KEGG pathways enriched by DEPs detected in proteomics. (D) A Venn diagram showing numbers of differentially expressed proteins when comparing Y331-ΔTE and Y331 at 0, 1 3, and 6 hpi after inoculation. (E) Density plot showing the relative fraction of DEGs in RNA-seq, and DEPs in proteomics at four time points.
FIGURE 7
FIGURE 7
Integrative analysis of RNA-seq and proteomics identified a number of genes co-induced upon resistance to stalk rot disease. The mRNA/protein expression fold changes of samples were calculated by comparing Y331-ΔTE and Y331 at four time points. mRNAs/proteins differentially expressed (| log2[FC]| > 1; p-adj < 0.05) in both, either and neither (unchanged) transcriptome and proteome studies were grouped and color-coded. Red and blue represent the Gene Ontology term significantly enriched by co-induced or co-repressed genes at transcriptional and translational levels, respectively.
FIGURE 8
FIGURE 8
The complex association between enriched KEGG pathways. Plots showing KEGG pathways significantly enriched by DEGs and DEPs detected in RNA-seq and proteomics at 0, 1, 3, and 6 hpi.
FIGURE 9
FIGURE 9
Metabolomic analysis revealed key pathways associated with early-stage resistance to gibberella stalk rot (GSR). (A) Principal component analysis to determine the global metabolic variation between Y331-ΔTE and Y331 at 0 and 24 hpi. (B) Heatmap showing the significance of metabolic pathways enriched by metabolic compounds detected in comparative metabolomics comparing Y331-ΔTE and Y331. (C) Boxplots showing the relative abundance of detected metabolic compounds in comparative metabolomics which are significantly altered between Y331-ΔTE and Y331. Black refers to Y331, and red refers to Y331-TE.
FIGURE 10
FIGURE 10
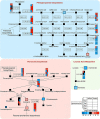
High-resolution mapping of the regulatory network to metabolic pathways. Simplified metabolic flow schemes described changes in metabolites and enriched enzymes associated with transcripts, proteins, phenylpropanoid biosynthesis, flavonoid biosynthesis, and linoleic acid metabolism. The colors indicated rates of upregulation or downregulation of groups of enzymes.

References

    1. Avci U., Earl Petzold H., Ismail I. O., Beers E. P., Haigler C. H. (2008). Cysteine proteases XCP1 and XCP2 aid micro-autolysis within the intact central vacuole during xylogenesis in Arabidopsis roots. Plant J. 56 303–315. 10.1111/j.1365-313X.2008.03592.x - DOI - PubMed
    1. Bai H., Si H., Zang J., Pang X., Yu L., Cao H., et al. (2021). Comparative proteomic analysis of the defense response to gibberella stalk rot in maize and reveals that ZmWRKY83 is involved in plant disease resistance. Front. Plant Sci. 12:694973. 10.3389/fpls.2021.694973 - DOI - PMC - PubMed
    1. Bari R., Jones J. D. (2009). Role of plant hormones in plant defence responses. Plant Mol. Biol. 69 473–488. 10.1007/s11103-008-9435-0 - DOI - PubMed
    1. Basu U., Narnoliya L., Srivastava R., Sharma A., Bajaj D., Daware A., et al. (2019). CLAVATA signaling pathway genes modulating flowering time and flower number in chickpea. Theor. Appl. Genet. 132 2017–2038. 10.1007/s00122-019-03335-y - DOI - PubMed
    1. Bechtold U., Penfold C. A., Jenkins D. J., Legaie R., Moore J. D., Lawson T., et al. (2016). Time-series transcriptomics reveals that agamous-like22 affects primary metabolism and developmental processes in drought-stressed Arabidopsis. Plant Cell 28 345–366. 10.1105/tpc.15.00910 - DOI - PMC - PubMed

LinkOut - more resources