

Wearables: An R Package With Accompanying Shiny Application for Signal Analysis of a Wearable Device Targeted at Clinicians and Researchers
- PMID: 35813597
- PMCID: PMC9262092
- DOI: 10.3389/fnbeh.2022.856544
Wearables: An R Package With Accompanying Shiny Application for Signal Analysis of a Wearable Device Targeted at Clinicians and Researchers
Abstract
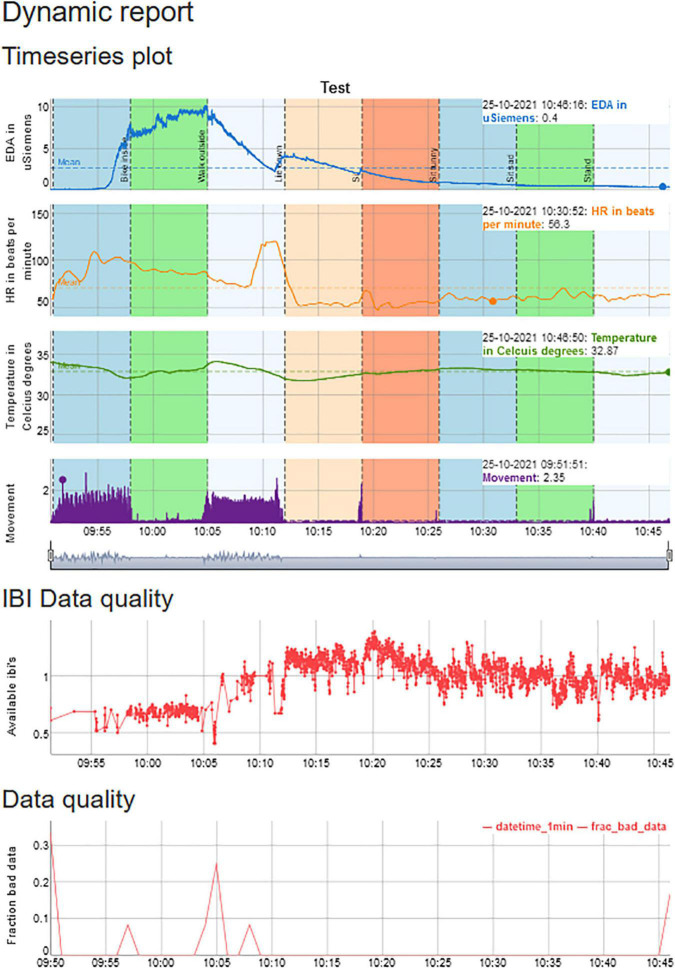
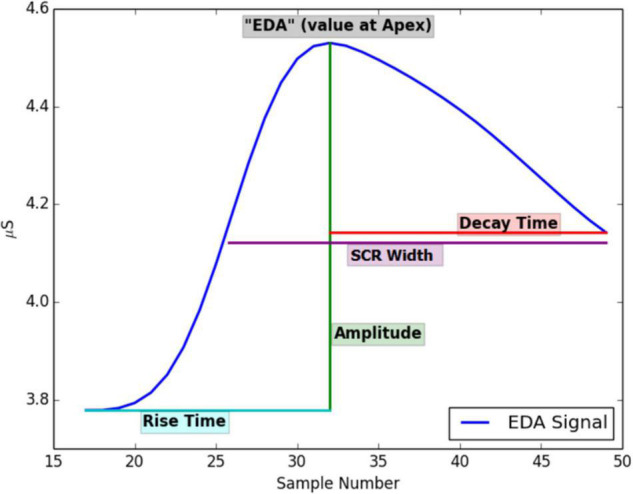
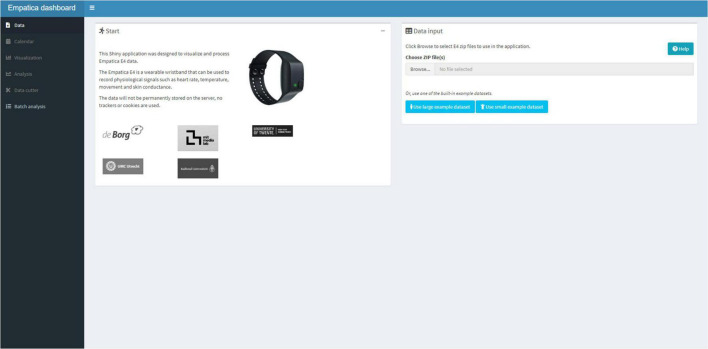
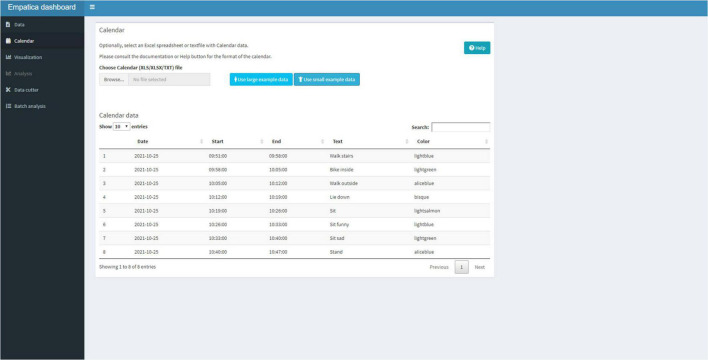
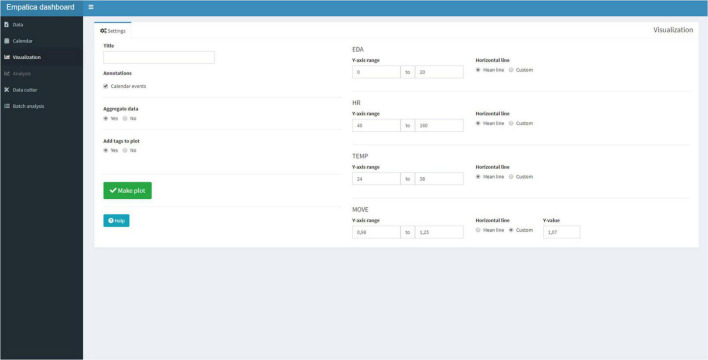
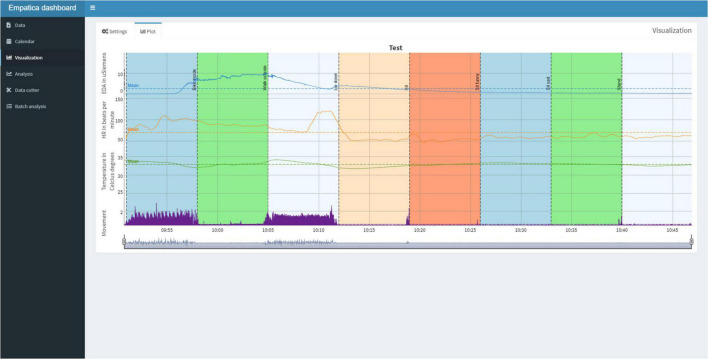
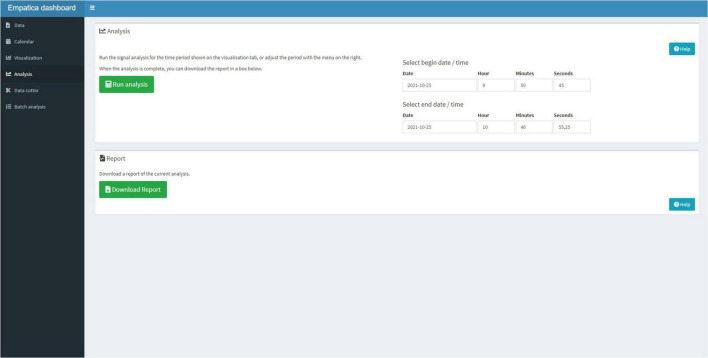
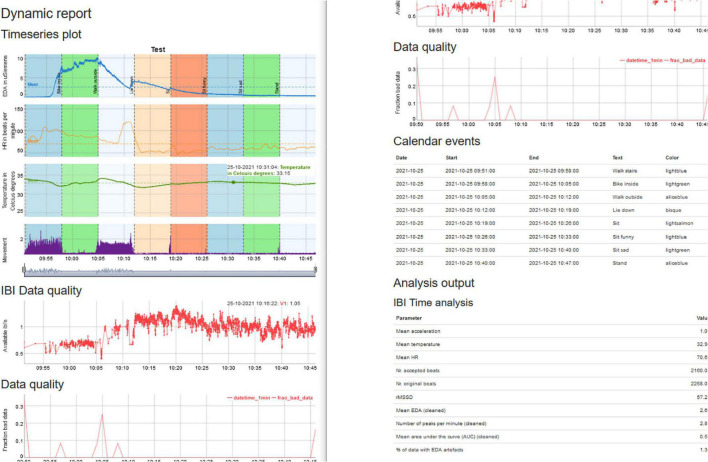
Physiological signals (e.g., heart rate, skin conductance) that were traditionally studied in neuroscientific laboratory research are currently being used in numerous real-life studies using wearable technology. Physiological signals obtained with wearables seem to offer great potential for continuous monitoring and providing biofeedback in clinical practice and healthcare research. The physiological data obtained from these signals has utility for both clinicians and researchers. Clinicians are typically interested in the day-to-day and moment-to-moment physiological reactivity of patients to real-life stressors, events, and situations or interested in the physiological reactivity to stimuli in therapy. Researchers typically apply signal analysis methods to the data by pre-processing the physiological signals, detecting artifacts, and extracting features, which can be a challenge considering the amount of data that needs to be processed. This paper describes the creation of a "Wearables" R package and a Shiny "E4 dashboard" application for an often-studied wearable, the Empatica E4. The package and Shiny application can be used to visualize the relationship between physiological signals and real-life stressors or stimuli, but can also be used to pre-process physiological data, detect artifacts, and extract relevant features for further analysis. In addition, the application has a batch process option to analyze large amounts of physiological data into ready-to-use data files. The software accommodates users with a downloadable report that provides opportunities for a careful investigation of physiological reactions in daily life. The application is freely available, thought to be easy to use, and thought to be easily extendible to other wearable devices. Future research should focus on the usability of the application and the validation of the algorithms.
Keywords: R Shiny application; electrodermal activity; heart rate; neuroscience; physiological reactivity; treatment; wearables.
Copyright © 2022 de Looff, Duursma, Noordzij, Taylor, Jaques, Scheepers, de Schepper and Koldijk.
Conflict of interest statement
PL was employed by Fivoor B.V and De Borg. RD was employed by the company Shintō Labs. The remaining authors declare that the research was conducted in the absence of any commercial or financial relationships that could be construed as a potential conflict of interest.
Figures
References
-
- Ates H. C., Yetisen A. K., Güder F., Dincer C. (2021). Wearable devices for the detection of COVID-19. Nat. Electron. 4 13–14. 10.1038/s41928-020-00533-1 - DOI
-
- Boucsein W. (2012). Electrodermal Activity, 2nd Edn. Boston, MA: Springer.
LinkOut - more resources
Full Text Sources