

Liensinine Inhibits Cell Growth and Blocks Autophagic Flux in Nonsmall-Cell Lung Cancer
- PMID: 35813859
- PMCID: PMC9270144
- DOI: 10.1155/2022/1533779
Liensinine Inhibits Cell Growth and Blocks Autophagic Flux in Nonsmall-Cell Lung Cancer
Abstract
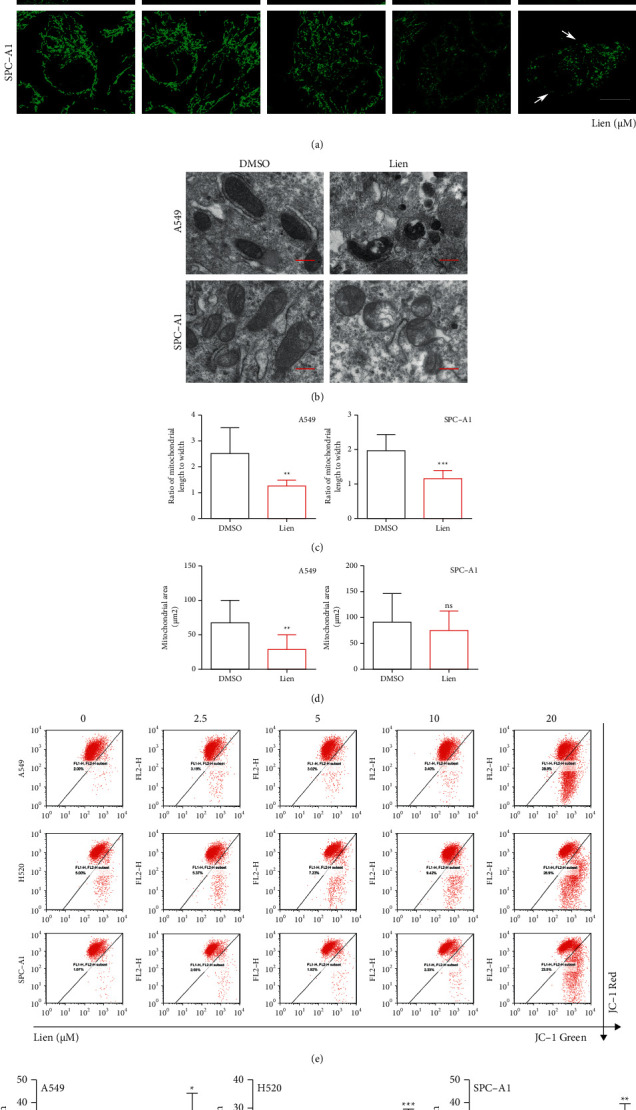
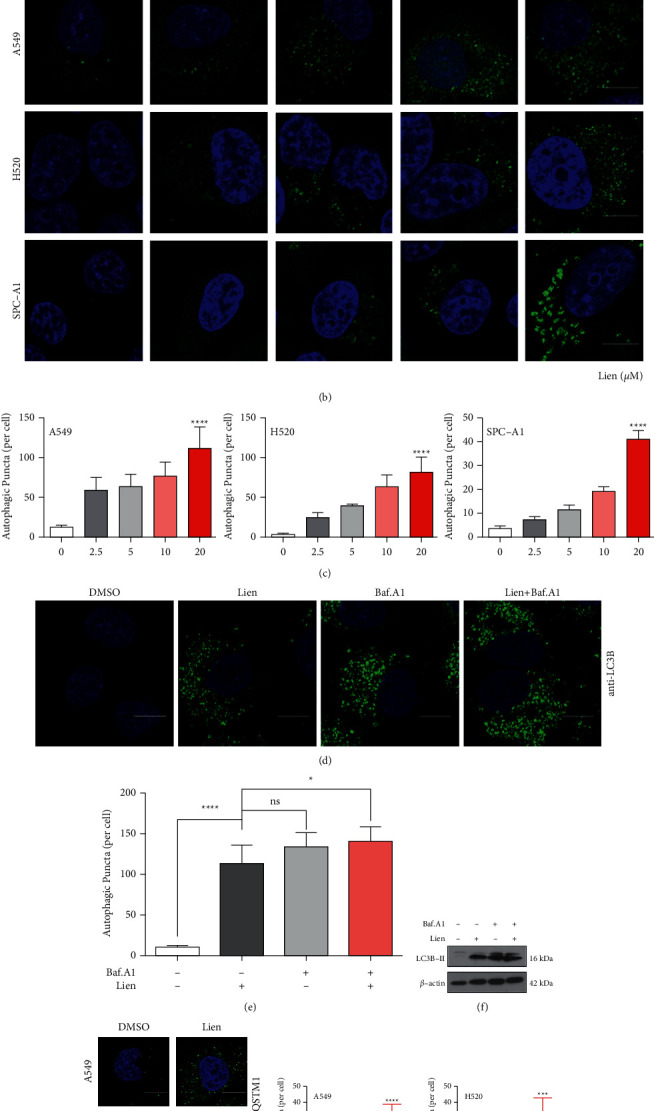
Liensinine is a bioactive component of Plumula Nelumbinis extracted from the green embryo of the mature seeds of Nelumbonaceae and exhibits therapeutic functions and noteworthy anti-tumor effects in recent studies. However, the potential anti-tumor property and the underlying mechanisms of liensinine in nonsmall-cell lung cancer (NSCLC) have not been illustrated. In this study, we demonstrated that liensinine has the potential anti-tumor property, and it could inhibit growth of NSCLC in vitro and in vivo. In addition, we found that although it induced significant accumulation of autophagosomes, liensinine could quench them for degradation and blocked autophagic flux. Importantly, we observed that liensinine inhibited the normal function of mitochondrial energy supply and impaired the lysosomal function. This research firstly provides a possibility insight that liensinine could be a novel therapeutic strategy for NSCLC.
Copyright © 2022 Minghui Chang et al.
Conflict of interest statement
The authors declare that they have no conflicts of interest.
Figures


Similar articles
-
A novel autophagy/mitophagy inhibitor liensinine sensitizes breast cancer cells to chemotherapy through DNM1L-mediated mitochondrial fission.Autophagy. 2015;11(8):1259-79. doi: 10.1080/15548627.2015.1056970. Autophagy. 2015. PMID: 26114658 Free PMC article.
-
Liensinine inhibited gastric cancer cell growth through ROS generation and the PI3K/AKT pathway.J Cancer. 2019 Oct 19;10(25):6431-6438. doi: 10.7150/jca.32691. eCollection 2019. J Cancer. 2019. PMID: 31772676 Free PMC article.
-
Liensinine Inhibits Osteosarcoma Growth by ROS-Mediated Suppression of the JAK2/STAT3 Signaling Pathway.Oxid Med Cell Longev. 2022 Jan 25;2022:8245614. doi: 10.1155/2022/8245614. eCollection 2022. Oxid Med Cell Longev. 2022. PMID: 35116094 Free PMC article.
-
Liensinine and Nuciferine, Bioactive Components of Nelumbo nucifera, Inhibit the Growth of Breast Cancer Cells and Breast Cancer-Associated Bone Loss.Evid Based Complement Alternat Med. 2017;2017:1583185. doi: 10.1155/2017/1583185. Epub 2017 Dec 3. Evid Based Complement Alternat Med. 2017. PMID: 29333179 Free PMC article.
-
Plumula Nelumbinis: A review of traditional uses, phytochemistry, pharmacology, pharmacokinetics and safety.J Ethnopharmacol. 2021 Feb 10;266:113429. doi: 10.1016/j.jep.2020.113429. Epub 2020 Oct 2. J Ethnopharmacol. 2021. PMID: 33011369 Review.
Cited by
-
Identification of key hub genes associated with anti-gastric cancer effects of lotus plumule based on machine learning algorithms.World J Gastrointest Oncol. 2025 Apr 15;17(4):103048. doi: 10.4251/wjgo.v17.i4.103048. World J Gastrointest Oncol. 2025. PMID: 40235894 Free PMC article.
-
Liensinine ameliorates ischemia-reperfusion-induced brain injury by inhibiting autophagy via PI3K/AKT signaling.Funct Integr Genomics. 2023 Apr 28;23(2):140. doi: 10.1007/s10142-023-01063-7. Funct Integr Genomics. 2023. PMID: 37118322
-
Role of liensinine in sensitivity of activated macrophages to ferroptosis and in acute liver injury.Cell Death Discov. 2023 Jun 23;9(1):189. doi: 10.1038/s41420-023-01481-3. Cell Death Discov. 2023. PMID: 37353487 Free PMC article.
-
Research progress on pharmacological effects and mechanisms of cepharanthine and its derivatives.Naunyn Schmiedebergs Arch Pharmacol. 2023 Nov;396(11):2843-2860. doi: 10.1007/s00210-023-02537-y. Epub 2023 Jun 20. Naunyn Schmiedebergs Arch Pharmacol. 2023. PMID: 37338575 Review.
References
-
- Gupta S. C., Prasad S., Sethumadhavan D. R., Nair M. S., Mo Y. Y., Aggarwal B. B. Nimbolide, a limonoid triterpene, inhibits growth of human colorectal cancer xenografts by suppressing the proinflammatory microenvironment. Clinical Cancer Research . 2013;19(16):4465–4476. doi: 10.1158/1078-0432.CCR-13-0080. - DOI - PMC - PubMed
LinkOut - more resources
Full Text Sources
