Within-community variation of interspecific divergence patterns in passerine gut microbiota
- PMID: 35813907
- PMCID: PMC9251858
- DOI: 10.1002/ece3.9071
Within-community variation of interspecific divergence patterns in passerine gut microbiota
Abstract
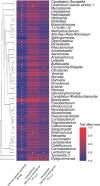
Gut microbiota (GM) often exhibit variation between different host species and co-divergence with hosts' phylogeny. Identifying these patterns is a key for understanding the mechanisms that shaped symbiosis between GM and its hosts. Therefore, both GM-host species specificity and GM-host co-divergence have been investigated by numerous studies. However, most of them neglected a possibility that different groups of bacteria within GM can vary in the tightness of their association with the host. Consequently, unlike most of these studies, we aimed to directly address how the strength of GM-host species specificity and GM-host co-divergence vary across different GM clades. We decomposed GM communities of 52 passerine species (394 individuals), characterized by 16S rRNA amplicon sequence variant (ASV) profiles, into monophyletic Binned Taxonomic units (BTUs). Subsequently, we analyzed strength of host species specificity and correlation with host phylogeny separately for resulting BTUs. We found that most BTUs exhibited significant host-species specificity in their composition. Notably, BTUs exhibiting high host-species specificity comprised bacterial taxa known to impact host's physiology and immune system. However, BTUs rarely displayed significant co-divergence with host phylogeny, suggesting that passerine GM evolution is not shaped primarily through a shared evolutionary history between the host and its gut microbes.
Keywords: 16S rRNA; co‐divergence; gut microbiota; metabarcoding; passerines.
© 2022 The Authors. Ecology and Evolution published by John Wiley & Sons Ltd.
Conflict of interest statement
All authors declare no conflict of interest.
Figures


Similar articles
-
Codiversification of gastrointestinal microbiota and phylogeny in passerines is not explained by ecological divergence.Mol Ecol. 2017 Oct;26(19):5292-5304. doi: 10.1111/mec.14144. Epub 2017 May 11. Mol Ecol. 2017. PMID: 28401612
-
Gut microbiota variation between climatic zones and due to migration strategy in passerine birds.Front Microbiol. 2023 Feb 1;14:1080017. doi: 10.3389/fmicb.2023.1080017. eCollection 2023. Front Microbiol. 2023. PMID: 36819027 Free PMC article.
-
Phylosymbiosis across Deeply Diverging Lineages of Omnivorous Cockroaches (Order Blattodea).Appl Environ Microbiol. 2020 Mar 18;86(7):e02513-19. doi: 10.1128/AEM.02513-19. Print 2020 Mar 18. Appl Environ Microbiol. 2020. PMID: 31953337 Free PMC article.
-
Gut Microbiota in Decapod Shrimps: Evidence of Phylosymbiosis.Microb Ecol. 2021 Nov;82(4):994-1007. doi: 10.1007/s00248-021-01720-z. Epub 2021 Feb 24. Microb Ecol. 2021. PMID: 33629169
-
Beyond 16S rRNA Community Profiling: Intra-Species Diversity in the Gut Microbiota.Front Microbiol. 2016 Sep 21;7:1475. doi: 10.3389/fmicb.2016.01475. eCollection 2016. Front Microbiol. 2016. PMID: 27708630 Free PMC article. Review.
References
-
- Bäckhed, F. , Ley, R. E. , Sonnenburg, J. L. , Peterson, D. A. , & Gordon, J. I. (2005). Host‐bacterial mutualism in the human intestine. Science, 307, 1915–1920. - PubMed
-
- Baumann, P. (2005). Biology of bacteriocyte‐associated endosymbionts of plant sap‐sucking insects. Annual Review of Microbiology, 59, 155–189. - PubMed
-
- Benjamini, Y. , & Hochberg, Y. (1995). Controlling the false discovery rate: A practical and powerful approach to multiple testing. Journal of the Royal Statistical Society, Series B, 57, 289–300.
LinkOut - more resources
Full Text Sources

