

Limited phylogeographic and genetic connectivity in Acacia species of low stature in an arid landscape
- PMID: 35813908
- PMCID: PMC9257521
- DOI: 10.1002/ece3.9052
Limited phylogeographic and genetic connectivity in Acacia species of low stature in an arid landscape
Abstract
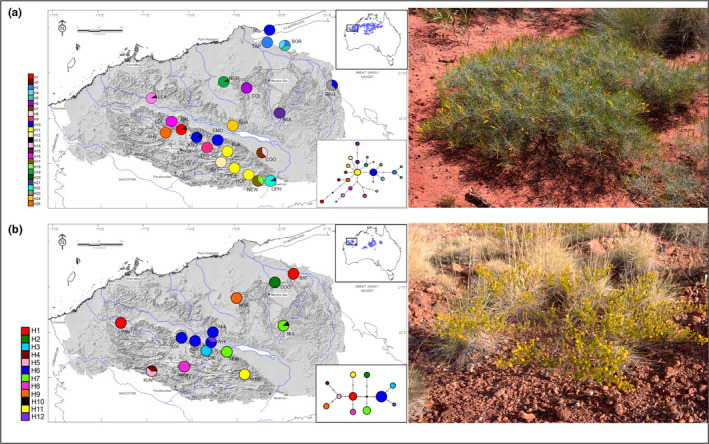
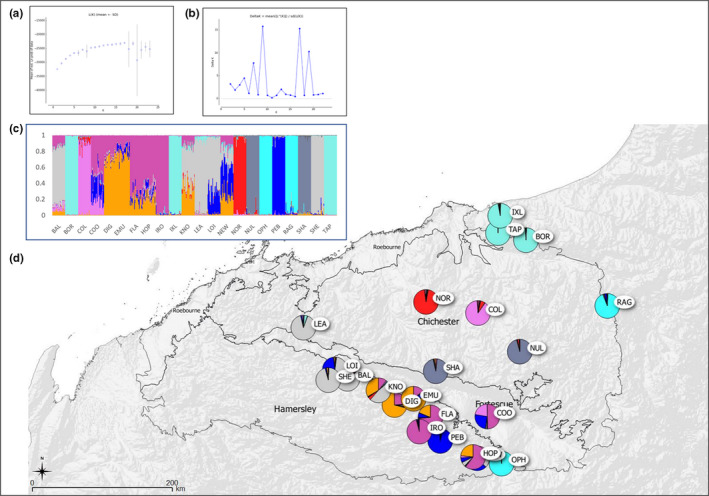
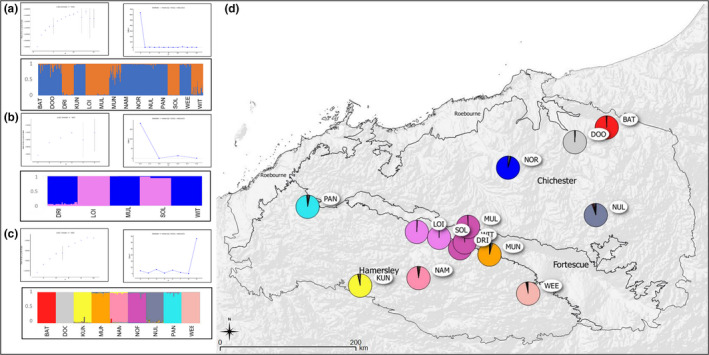
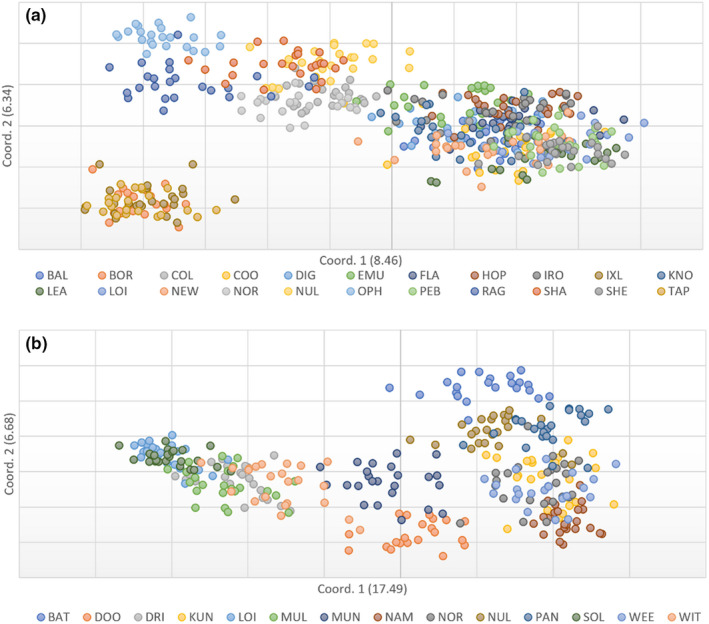
Widespread plant species are expected to maintain genetic diversity and gene flow via pollen and seed dispersal. Stature is a key life history trait that affects seed and potentially pollen dispersal, with limited stature associated with limited dispersal and greater genetic differentiation. We sampled Hill's tabletop wattle (Acacia hilliana) and curry wattle (Acacia spondylophylla), two co-distributed, widespread, Acacia shrubs of low stature, across the arid Pilbara region of north-western Australia. Using chloroplast sequence and nuclear microsatellite data we evaluated patterns of population genetic and phylogeographic diversity and structure, demographic signals, ratios of pollen to seed dispersal, evidence for historical refugia, and association between elevation and diversity. Results showed strong phylogeographic (chloroplast, G ST = 0.831 and 0.898 for A. hilliana and A. spondylophylla, respectively) and contemporary (nuclear, F ST = 0.260 and 0.349 for A. hilliana and A. spondylophylla, respectively) genetic structure in both species. This indicates limited genetic connectivity via seed and pollen dispersal associated with Acacia species of small stature compared to taller tree and shrub acacias across the Pilbara bioregion. This effect of stature on genetic structure is superimposed on moderate levels of genetic diversity that were expected based on widespread ranges (haplotype diversity h = 25 and 12; nuclear diversity He = 0.60 and 0.47 for A. hilliana and A. spondylophylla, respectively). Contemporary genetic structure was congruent at the greater landscape scale, especially in terms of strong genetic differentiation among geographically disjunct populations in less elevated areas. Measures of diversity and connectivity were associated with traits of greater geographic population proximity, population density, population size, and greater individual longevity, and some evidence for range expansion in A. hilliana. Results illustrate that low stature is associated with limited dispersal and greater patterns of genetic differentiation for congenerics in a common landscape and highlight the complex influence of taxon-specific life history and ecological traits to seed and pollen dispersal.
Keywords: Acacia; Pilbara; arid zone; genetic connectivity; genetic diversity; stature.
© 2022 State of Western Australia. Ecology and Evolution published by John Wiley & Sons Ltd.
Conflict of interest statement
7The authors declare no conflict of interest.
Figures
Similar articles
-
The nuanced nature of mesic refugia in arid landscapes: a tale of two peas.Ann Bot. 2022 Dec 16;130(6):901-916. doi: 10.1093/aob/mcac126. Ann Bot. 2022. PMID: 36219678 Free PMC article.
-
Extensive Genetic Connectivity and Historical Persistence Are Features of Two Widespread Tree Species in the Ancient Pilbara Region of Western Australia.Genes (Basel). 2020 Jul 29;11(8):863. doi: 10.3390/genes11080863. Genes (Basel). 2020. PMID: 32751318 Free PMC article.
-
Genetic connectivity and diversity in inselberg populations of Acacia woodmaniorum, a rare endemic of the Yilgarn Craton banded iron formations.Heredity (Edinb). 2013 Nov;111(5):437-44. doi: 10.1038/hdy.2013.66. Epub 2013 Jul 17. Heredity (Edinb). 2013. PMID: 23860233 Free PMC article.
-
Extensive long-distance pollen dispersal and highly outcrossed mating in historically small and disjunct populations of Acacia woodmaniorum (Fabaceae), a rare banded iron formation endemic.Ann Bot. 2014 Oct;114(5):961-71. doi: 10.1093/aob/mcu167. Epub 2014 Aug 6. Ann Bot. 2014. PMID: 25100675 Free PMC article.
-
Demographic and genetic connectivity: the role and consequences of reproduction, dispersal and recruitment in seagrasses.Biol Rev Camb Philos Soc. 2017 May;92(2):921-938. doi: 10.1111/brv.12261. Epub 2016 Mar 23. Biol Rev Camb Philos Soc. 2017. PMID: 27010433 Review.
Cited by
-
The nuanced nature of mesic refugia in arid landscapes: a tale of two peas.Ann Bot. 2022 Dec 16;130(6):901-916. doi: 10.1093/aob/mcac126. Ann Bot. 2022. PMID: 36219678 Free PMC article.
References
-
- Aguilar, R. , Ashworth, L. , Geletto, L. , & Aizen, M. (2006). Plant reproductive susceptibility to habitat fragmentation: A review and synthesis through a meta‐analysis. Ecology Letters, 9, 968–980. - PubMed
-
- Allendorf, F. W. , Luikart, G. , & Aitken, S. (2013). Conservation and the genetics of populations (2nd ed.). Wiley‐Blackwell.
-
- Arbogast, B. , & Kenagy, G. (2001). Comparative phylogeography as an integrative approach to historical biogeography. Journal of Biogeography, 28, 819–825.
-
- Avise, J. (2000). Phylogeography: The history and formation of species. Harvard University Press.
-
- Bandelt, H. , Forster, P. , & Röhl, A. (1999). Median‐joining networks for inferring intraspecific phylogenies. Molecular Biology and Evolution, 16, 37–48. - PubMed
LinkOut - more resources
Full Text Sources
