. 2022 Jun 24:14:846902.
doi: 10.3389/fnagi.2022.846902. eCollection 2022.

Most Pathways Can Be Related to the Pathogenesis of Alzheimer's Disease

Affiliations

Most Pathways Can Be Related to the Pathogenesis of Alzheimer's Disease

Sarah L Morgan et al. Front Aging Neurosci. .

Abstract

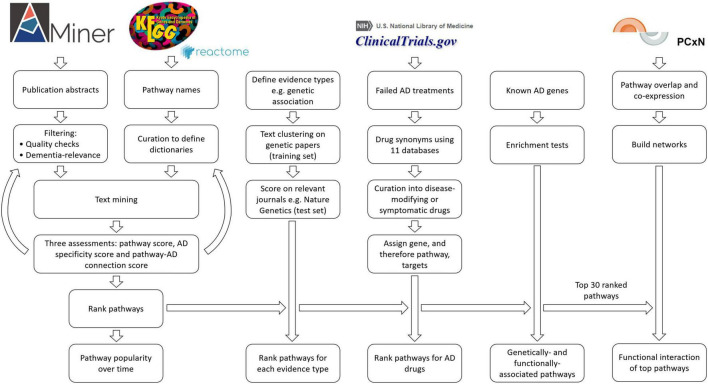
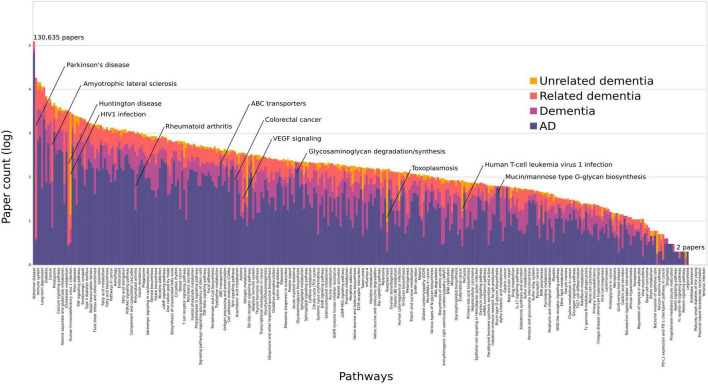
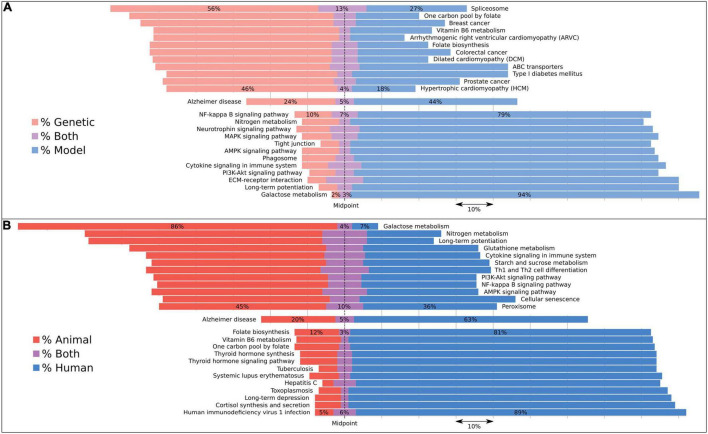
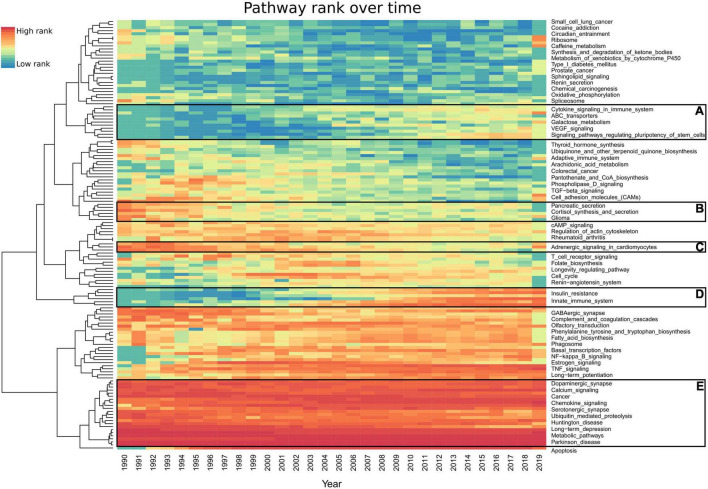
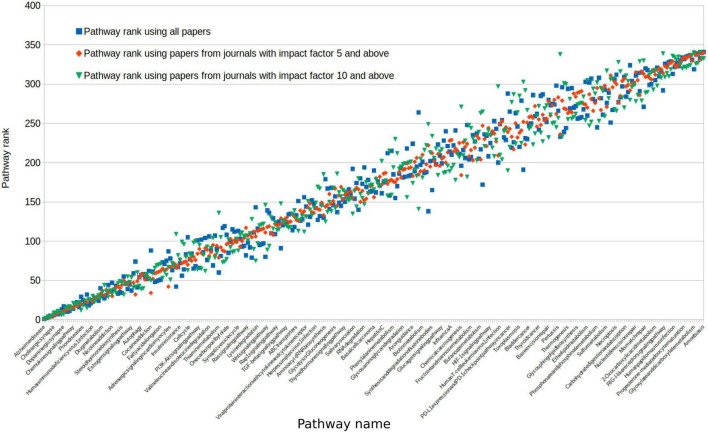
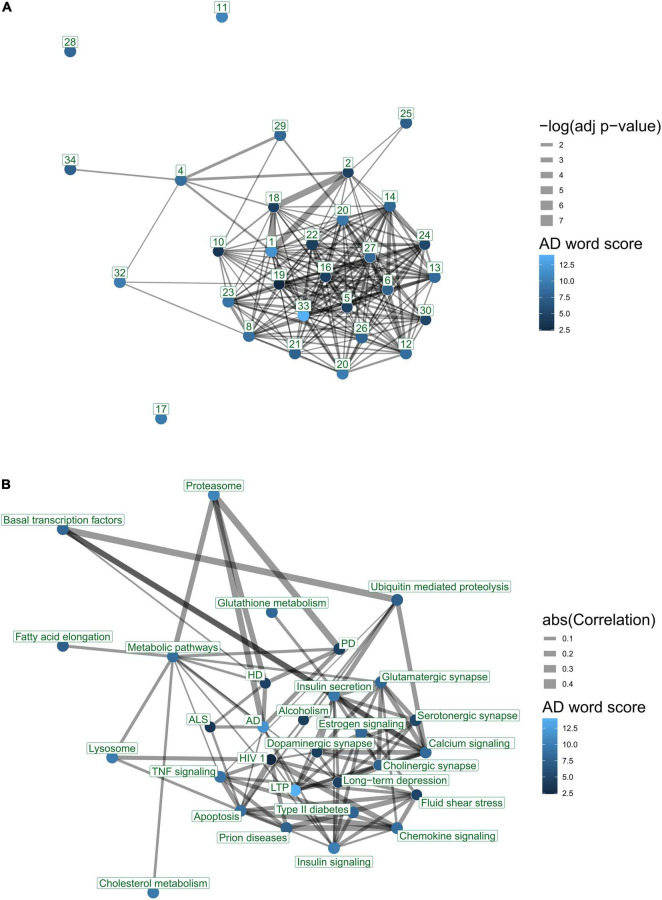
Alzheimer's disease (AD) is a complex neurodegenerative disorder. The relative contribution of the numerous underlying functional mechanisms is poorly understood. To comprehensively understand the context and distribution of pathways that contribute to AD, we performed text-mining to generate an exhaustive, systematic assessment of the breadth and diversity of biological pathways within a corpus of 206,324 dementia publication abstracts. A total of 91% (325/335) of Kyoto Encyclopedia of Genes and Genomes (KEGG) pathways have publications containing an association via at least 5 studies, while 63% of pathway terms have at least 50 studies providing a clear association with AD. Despite major technological advances, the same set of top-ranked pathways have been consistently related to AD for 30 years, including AD, immune system, metabolic pathways, cholinergic synapse, long-term depression, proteasome, diabetes, cancer, and chemokine signaling. AD pathways studied appear biased: animal model and human subject studies prioritize different AD pathways. Surprisingly, human genetic discoveries and drug targeting are not enriched in the most frequently studied pathways. Our findings suggest that not only is this disorder incredibly complex, but that its functional reach is also nearly global. As a consequence of our study, research results can now be assessed in the context of the wider AD literature, supporting the design of drug therapies that target a broader range of mechanisms. The results of this study can be explored at www.adpathways.org.

Keywords: Alzheimer’s disease; dementia; disease mechanism; pathway; text-mining.


Conflict of interest statement

The authors declare that the research was conducted in the absence of any commercial or financial relationships that could be construed as a potential conflict of interest.

Figures

FIGURE 1
FIGURE 1
Flowchart outlining the study methods. For the filtering of publications, we kept only studies with an abstract and with the terms Alzheimer or dementia. We removed duplicates, abstracts with negative findings, abstracts with dementia as an exclusion criterion, abstracts that were too long or too short, and finally, all keywords if there were more than 30 (Supplementary Methods).
FIGURE 2
FIGURE 2
All pathways ordered by the log of their total paper counts associating them with AD or dementia. We have colored each bar to represent the percentage of papers containing an adequate number of AD-relevant words (purple), dementia terms (pink), dementia caused by related disorders (orange), and unrelated dementias (yellow). Pathways with only 1 study do not display on this scale. The average percentage of AD-specific studies per pathway was 64% excluding those with less than 50 studies. The highest proportions were found in ABC transporters (88%), Alzheimer’s disease (95%), the glycosaminoglycan pathways (93–94%), and the O-glycan pathways (98%). These data are summarized in Supplementary Table 4.
FIGURE 3
FIGURE 3
Pathways associated with AD subcategorized by evidence type using dictionaries to reveal biases in their associations. Bars are aligned along the midpoint of the neutral grouping, so that a direct comparison can be made of the two competing groups. The missing percentage from this chart is for studies assigned to neither evidence category, but this value can be inferred by subtracting the total bar quantity from 100, or found in Supplementary Table 5. We compared (A) genetic with model studies and (B) animal with human studies. We included the 12 most skewed pathways for each of these four evidence types as well as the Alzheimer’s disease pathway, which represents the AD expected rate for each category. Both human and animal studies were included under the model category. Pathways with less than 100 studies associating them to dementia were excluded.
FIGURE 4
FIGURE 4
Heatmap representing each pathway’s prevalence over the last 30 years. Each year’s highest ranked pathways are denoted in red, while the lowest rank is denoted in blue. For an improved visualization, we excluded 142 pathways having less than 20 studies per year. AMiner was updated in 2019 so it only captures part of that year. (A,D) Pathways which gained interest. (B,C) Pathways which have lost interest since the 1990s. (E) Pathways which have been consistent in their high scores every year since 1990. Full results can be found in Supplementary Table 6.
FIGURE 5
FIGURE 5
We reassessed all pathway ranks after selecting journal sources with a differing impact. Impact of greater than 5 (red) or greater than 10 (green) comparing this to all studies from any journal (blue). For clarity, pathways on this figure were ordered by the average rank across these three groups. Because of this, the variability in impact >5 (red) falsely appears to be less, as it is a halfway point between the other two scores.
FIGURE 6
FIGURE 6
Interaction networks of top 30 KEGG pathways according to text-mining. Nodes represent pathways. Node color indicates AD word score denoting average number of AD-related terms per paper, for each pathway. Edges reflect a significant association between two pathways. Edge thicknesses reflect the strength of association. (A) Gene overlap between pathways. Edges represent significant enrichment between pairs of pathways (FDR < 0.05). Node number indicates ranking in the literature. Edge thicknesses reflect significance (–log p-value) of enrichment. (B) Co-expression of pathways. Edges represent canonical correlations as defined by a pathway correlation analysis (PCxN) (Pita-Juárez et al., 2018). Edge thickness values represent the absolute value of correlation between the two pathways. The figure was generated using the igraph package. The nodes were placed in the two-dimensional coordinates using a forced layout algorithm for the gene overlap network. The co-expression network was aligned to the same layout as the gene overlap network.

References

    1. Alzforum. (2021). Therapeutics | ALZFORUM. Available Online at: https://www.alzforum.org/therapeutics (Accessed on May 28 2021)
    1. Barbarino J. M., Whirl-Carrillo M., Altman R. B., Klein T. E. (2018). PharmGKB: A worldwide resource for pharmacogenomic information. Wiley Interdiscip. Rev. Syst. Biol. Med. 10:e1417. 10.1002/wsbm.1417 - DOI - PMC - PubMed
    1. Benjamini Y., Hochberg Y. (1995). Controlling the False Discovery Rate: A Practical and Powerful Approach to Multiple Testing. J.R. Stat. Soc. 57 289–300. 10.1111/j.2517-6161.1995.tb02031.x - DOI
    1. Branconnier R. J., Branconnier M. E., Walshe T. M., McCarthy C., Morse P. A. (1992). Blocking the Ca(2+)-activated cytotoxic mechanisms of cholinergic neuronal death: a novel treatment strategy for Alzheimer’s disease. Psychopharmacol. Bull. 28 175–181. - PubMed
    1. Brown A. S., Patel C. J. (2017). A standard database for drug repositioning. Sci. Data 4:170029. 10.1038/sdata.2017.29 - DOI - PMC - PubMed