. 2022 Jun 22:13:874375.
doi: 10.3389/fphar.2022.874375. eCollection 2022.

Profiling Differential Effects of 5 Selective Serotonin Reuptake Inhibitors on TLRs-Dependent and -Independent IL-6 Production in Immune Cells Identifies Fluoxetine as Preferred Anti-Inflammatory Drug Candidate

Affiliations

Profiling Differential Effects of 5 Selective Serotonin Reuptake Inhibitors on TLRs-Dependent and -Independent IL-6 Production in Immune Cells Identifies Fluoxetine as Preferred Anti-Inflammatory Drug Candidate

Yohei Takenaka et al. Front Pharmacol. .

Abstract

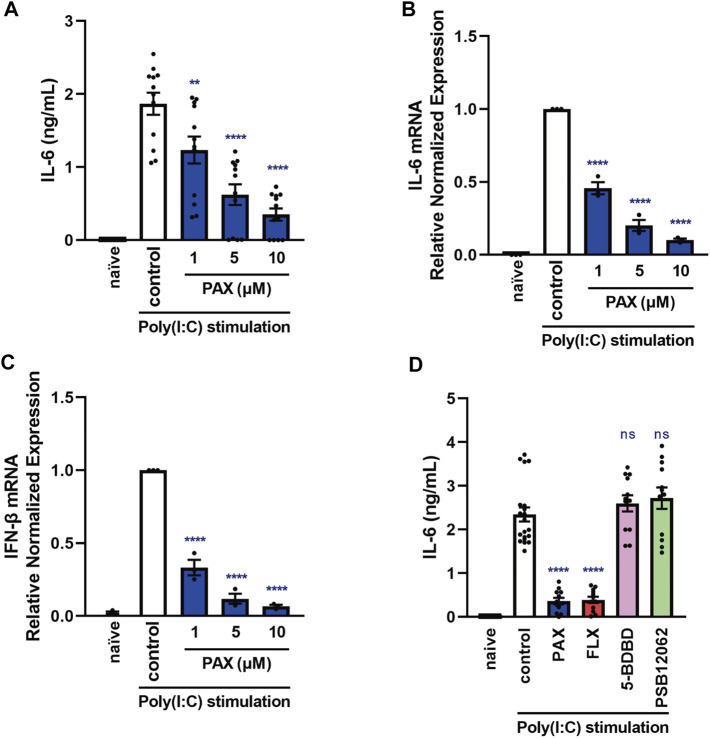
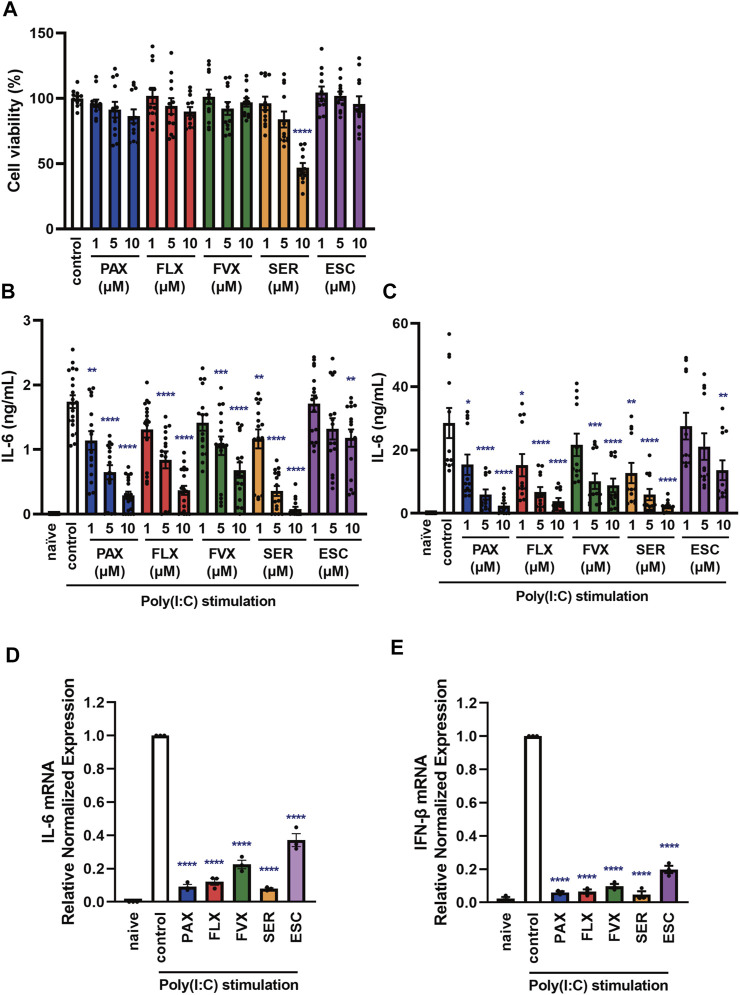
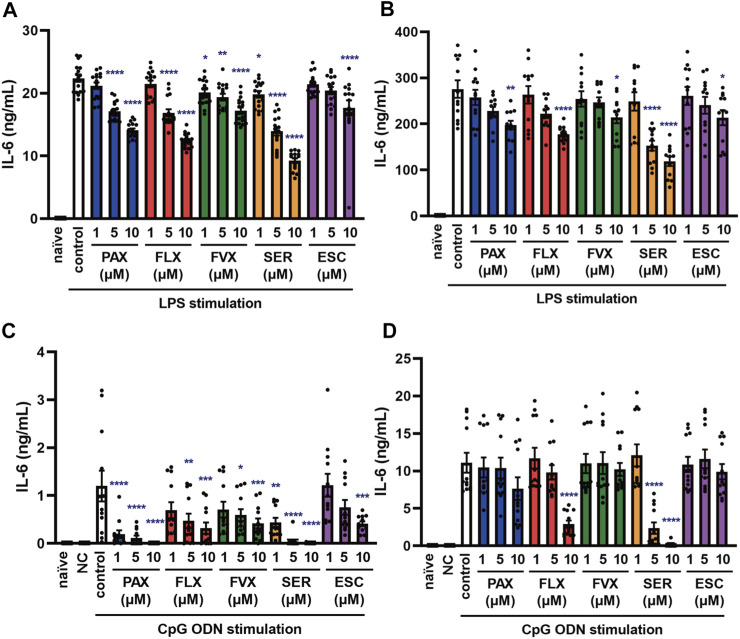
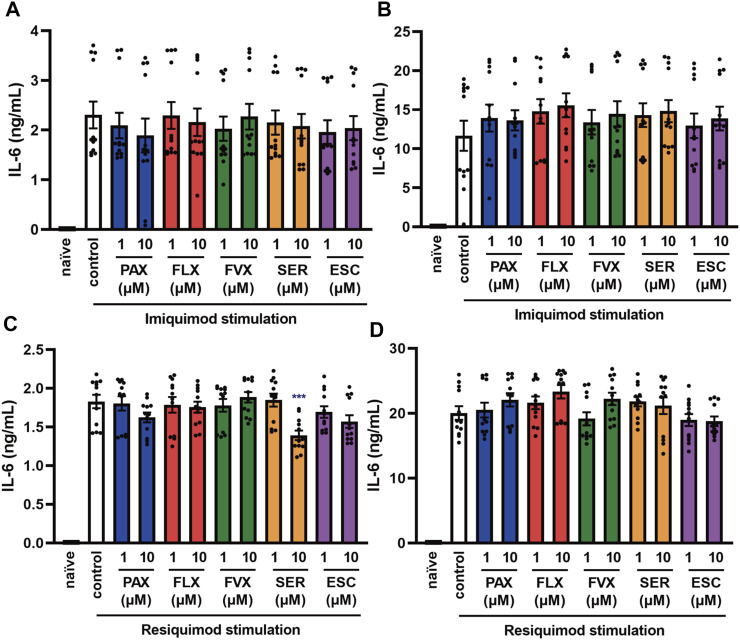
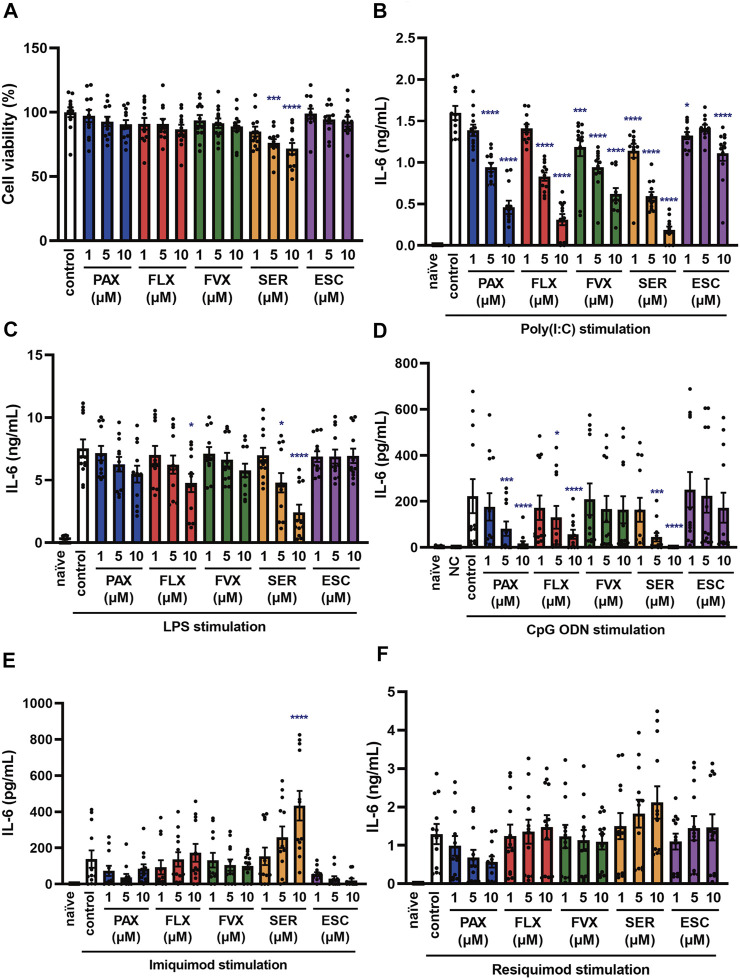
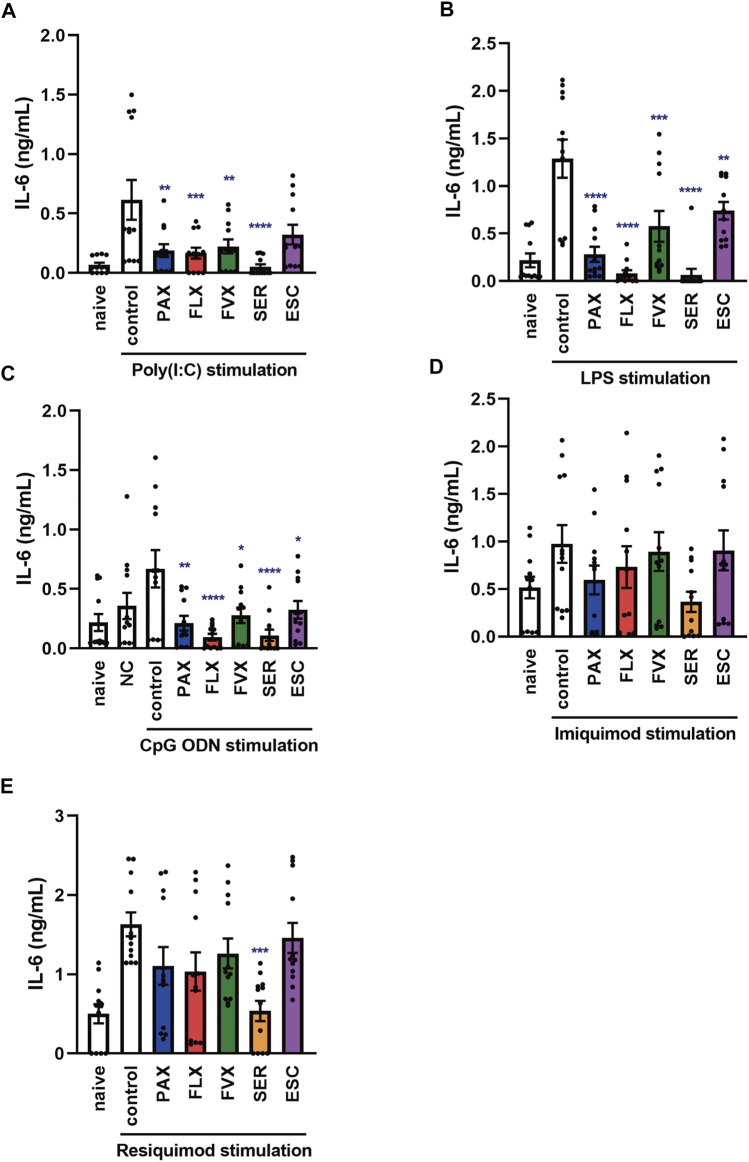
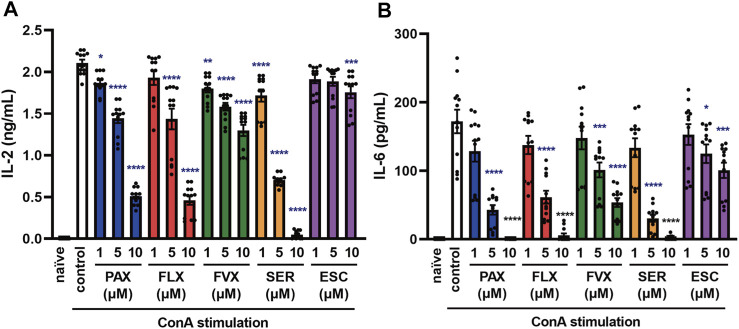
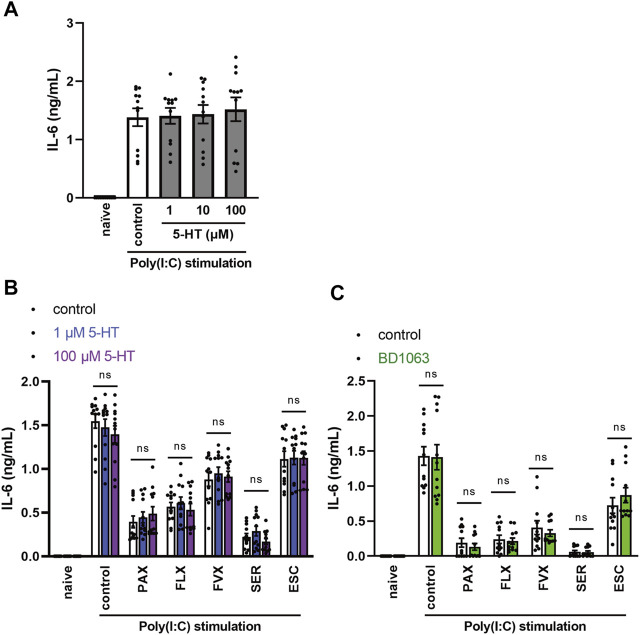
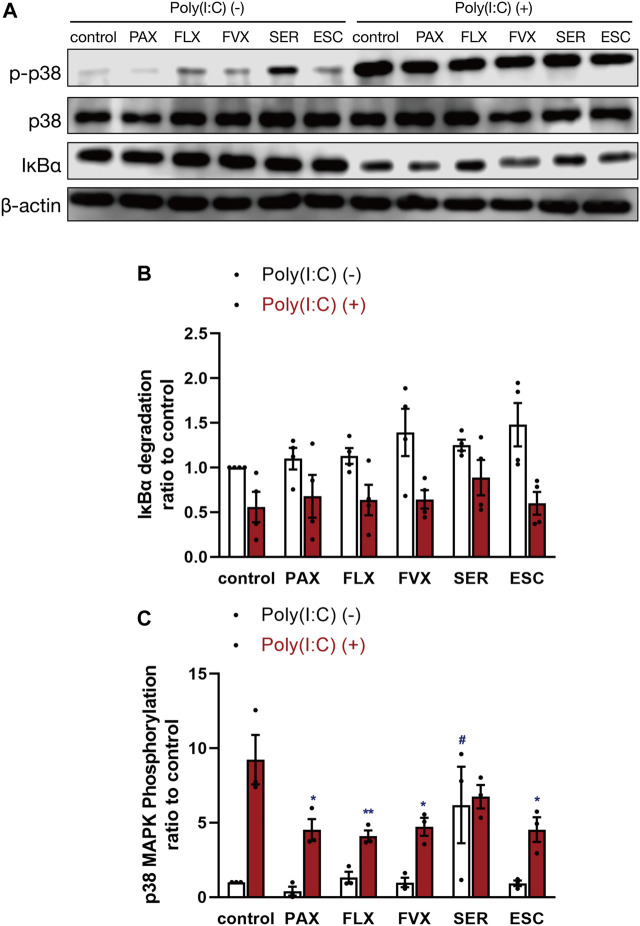
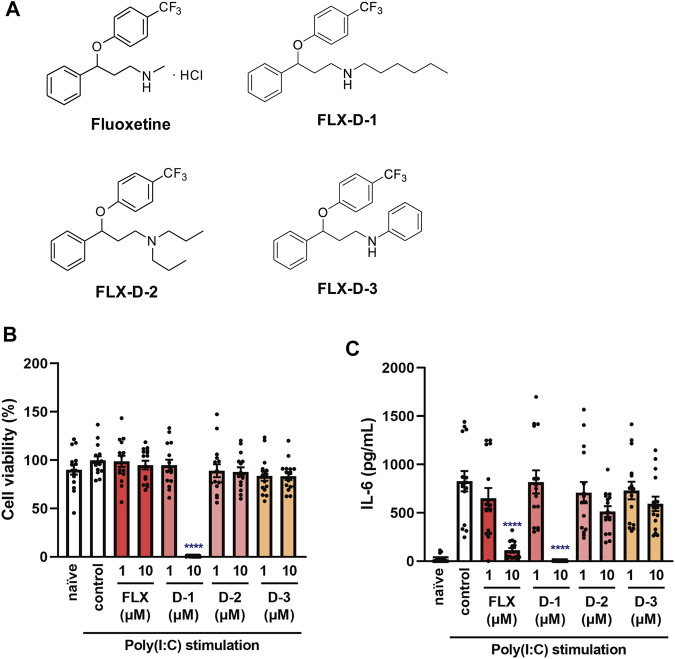
Excessive proinflammatory cytokine production induced by abnormal activation of Toll-like receptor (TLR) signaling, for example, by SARS-CoV-2 infection, can cause a fatal cytokine storm. The selective serotonin reuptake inhibitors (SSRIs) fluoxetine and fluvoxamine, used to treat depression, were recently reported to reduce the risk of severe disease in patients with coronavirus disease 2019 (COVID-19), but the mechanisms of the anti-inflammatory effects of SSRIs, and which SSRI would be most suitable as an anti-inflammatory drug, remain unclear. Here, we examined the inhibitory effects of 5 FDA-approved SSRIs, paroxetine, fluoxetine, fluvoxamine, sertraline and escitalopram, on the production of interleukin-6 (IL-6) induced by stimulation with multiple TLR agonists in murine macrophages and dendritic cells, and on the production of cytokines induced by concanavalin A in murine lymphocytes. In J774.1 murine macrophage cells, pretreatment with SSRIs significantly suppressed IL-6 release induced by TLR3 agonist poly(I:C), TLR4 agonist LPS or TLR9 agonist CpG ODN, but did not affect IL-6 release induced by TLR7 agonists imiquimod or resiquimod. In accordance with the results obtained in J774.1 cells, pretreatment with SSRIs also suppressed IL-6 release induced by a TLR3, TLR4 or TLR9 agonist in bone marrow-derived dendritic cells and peritoneal cells of C57BL/6 mice. On the other hand, interestingly, sertraline alone among the SSRIs amplified IL-6 production induced by TLR7 agonists in murine dendritic cells, though not in macrophages. Concanavalin A-induced production of IL-6 or IL-2 in murine lymphocytes was suppressed by SSRIs, suggesting that SSRIs also inhibit TLRs-independent IL-6 production. Since SSRIs suppressed both IL-6 production induced by multiple TLR agonists in macrophages or dendritic cells and TLR-independent IL-6 production in lymphocytes, they are promising candidates for treatment of patients with cytokine storm, which is mediated by overactivation of multiple TLRs in a complex manner, leading to the so-called IL-6 amplifier, an IL-6 overproduction loop. However, the 5 SSRIs examined here all showed different effects. Overall, our results suggest that fluoxetine may be the most promising candidate as an anti-inflammatory drug. An examination of the structural requirements indicated that the N-methyl group of fluoxetine has a critical role in the inhibition of IL-6 production.

Keywords: IL-6; Toll-like receptor; concanavalin A; cytokine; dendritic cells; lymphocytes; macrophage; selective serotonin reuptake inhibitor.


Conflict of interest statement

The authors declare that the research was conducted in the absence of any commercial or financial relationships that could be construed as a potential conflict of interest.

Figures

FIGURE 1
FIGURE 1
Effects of paroxetine on cytokine production induced by a TLR3 agonist in J774.1 murine macrophage cells. (A–C) J774.1 cells were pre-incubated with paroxetine (1–10 µM) for 30 min and then incubated with poly(I:C) (5 μg/ml) for 3 h (B,C) or 6 h (A). (D) Cells were pre-incubated with paroxetine (10 µM), fluoxetine (10 µM), 5-BDBD (10 µM) or PSB12062 (10 µM) for 30 min and then incubated with poly(I:C) for 6 h. (A, D) IL-6 was measured by means of ELISA. (B,C) Expression of IL-6 or IFN-β mRNA was analyzed by real-time RT-PCR. Error bars indicate ±SE [(A): n = 12, (B,C): n = 3, (D): n = 12–20, three or more independent experiments]. Statistical analysis was performed by one-way ANOVA followed by Dunnett’s test. Significant differences between control and test groups are indicated by **p < 0.01, ****p < 0.0001. ns, not significant; PAX, paroxetine; FLX, fluoxetine.
FIGURE 2
FIGURE 2
Effects of SSRIs on cytokine production induced by a TLR3 agonist in J774.1 murine macrophage cells. (A) J774.1 cells were incubated with each SSRI (1–10 µM) for 24 h. Cell viability was evaluated by MTT assay. (B,C) Cells were pre-incubated with each SSRI (1–10 µM) for 30 min and then incubated with poly(I:C) (5 μg/ml) for 6 h (B) or 24 h (C). IL-6 was measured by means of ELISA. (D,E) Cells were pre-incubated with each SSRI (10 µM) for 30 min and then incubated with poly(I:C) (5 μg/ml) for 3 h. Expression of IL-6 or IFN-β mRNA was analyzed by real-time RT-PCR. Error bars indicate ±SE [(A): n = 12, (B): n = 16–20, (C): n = 12, (D,E): n = 3, three or more independent experiments]. Statistical analysis was performed by one-way ANOVA followed by Dunnett’s test. Significant differences between control and test groups are indicated by *p < 0.05, **p < 0.01, ***p < 0.001, ****p < 0.0001. PAX, paroxetine; FLX, fluoxetine; FVX, fluvoxamine; SER, sertraline; ESC, escitalopram.
FIGURE 3
FIGURE 3
Effects of SSRIs on IL-6 production induced by TLR4 or TLR9 agonist in J774.1 murine macrophage cells. J774.1 cells were pre-incubated with each SSRI (1–10 µM) for 30 min and then incubated with LPS (1 μg/ml) for 6 h (A) or 24 h (B), or with CpG ODN or negative control ODN (200 ng/ml) for 6 h (C) or 24 h (D). IL-6 was measured by means of ELISA. Error bars indicate ±SE [(A): n = 16, (B–D): n = 12, three or more independent experiments]. Statistical analysis was performed by one-way ANOVA followed by Dunnett’s test. Significant differences between control and test groups are indicated by *p < 0.05, **p < 0.01, ***p < 0.001, ****p < 0.0001. NC, negative control ODN. PAX, paroxetine; FLX, fluoxetine; FVX, fluvoxamine; SER, sertraline; ESC, escitalopram.
FIGURE 4
FIGURE 4
Effects of SSRIs on IL-6 production induced by TLR7 agonists in J774.1 murine macrophage cells. J774.1 cells were pre-incubated with each SSRI (1–10 µM) for 30 min and then incubated with imiquimod (1 μg/ml) for 6 h (A) or 24 h (B), or resiquimod (10 ng/ml) for 6 h (C) or 24 h (D). IL-6 was measured by means of ELISA. Error bars indicate ±SE (n = 12, three independent experiments). Statistical analysis was performed by one-way ANOVA followed by Dunnett’s test. Significant differences between control and test groups are indicated by ***p < 0.001. PAX, paroxetine; FLX, fluoxetine; FVX, fluvoxamine; SER, sertraline; ESC, escitalopram.
FIGURE 5
FIGURE 5
Effects of SSRIs on IL-6 production induced by TLR agonists in BMDCs. (A) BMDCs were incubated with each SSRI (1–10 µM) for 24 h. Cell viability was evaluated by MTT assay. (B–F) BMDCs were pre-incubated with each SSRI (1–10 µM) for 30 min and then incubated with poly(I:C) (10 μg/ml) (B), LPS (1 μg/ml) (C), CpG ODN or negative control ODN (200 ng/ml) (D), imiquimod (1 μg/ml) (E) or resiquimod (10 ng/ml) (F) for 24 h. IL-6 was measured by means of ELISA. Error bars indicate ±SE [(A–F): n = 12, three independent experiments]. Statistical analysis was performed by one-way ANOVA followed by Dunnett’s test. Significant differences between control and test groups are indicated by *p < 0.05, ***p < 0.001, ****p < 0.0001. NC, negative control ODN. PAX, paroxetine; FLX, fluoxetine; FVX, fluvoxamine; SER, sertraline; ESC, escitalopram.
FIGURE 6
FIGURE 6
Effects of SSRIs on IL-6 production induced by TLR agonists in murine peritoneal cells. Peritoneal cells isolated from C57BL/6 mice were pre-incubated with each SSRI (1–10 µM) for 30 min and then incubated with poly(I:C) (5 μg/ml) (A), LPS (1 μg/ml) (B), CpG ODN or negative control ODN (200 ng/ml) (C), imiquimod (1 μg/ml) (D) or resiquimod (10 ng/ml) (E) for 24 h. IL-6 was measured by means of ELISA. Error bars indicate ±SE (n = 12, three independent experiments). Statistical analysis was performed by one-way ANOVA followed by Dunnett’s test. Significant differences between control and test groups are indicated by *p < 0.05, **p < 0.01, ***p < 0.001, ****p < 0.0001. NC, negative control ODN. PAX, paroxetine; FLX, fluoxetine; FVX, fluvoxamine; SER, sertraline; ESC, escitalopram.
FIGURE 7
FIGURE 7
Effects of SSRIs on cytokine production induced by a T cell activator in murine splenic lymphocytes. Splenic lymphocytes of C57BL/6 mice were pre-incubated with each SSRI (1–10 µM) for 30 min and then incubated with ConA (5 μg/ml) for 24 h. IL-2 (A) or IL-6 (B) was measured by means of ELISA. Error bars indicate ±SE (n = 12, three independent experiments). Statistical analysis was performed by one-way ANOVA followed by Dunnett’s test. Significant differences between control and test groups are indicated by *p < 0.05, **p < 0.01, ***p < 0.001, ****p < 0.0001. ConA, Concanavalin A; PAX, paroxetine; FLX, fluoxetine; FVX, fluvoxamine; SER, sertraline; ESC, escitalopram.
FIGURE 8
FIGURE 8
Effects of serotonin or sigma-1 receptor antagonist on the inhibition of TLR3 agonist-induced IL-6 production by SSRIs in J774.1 murine macrophage cells. (A) J774.1 cells were pre-incubated with serotonin (1, 10, 100 µM) for 30 min and then incubated with poly(I:C) (5 μg/ml) for 6 h (B,C) Cells were pre-incubated with serotonin (1, 100 µM) (B) or sigma-1 receptor antagonist, BD1063 (10 µM) (C) for 30 min, and incubated with each SSRI (10 µM) for 30 min, then incubated with poly(I:C) (5 μg/ml) for 6 h. IL-6 was measured by means of ELISA. Error bars indicate ±SE (n = 12, three independent experiments). Statistical analysis was performed by one-way ANOVA followed by Dunnett’s test (A), two-way ANOVA followed by Dunnett’s test (B), or two-way ANOVA followed by Bonferroni’s test (C). 5-HT: 5-hydroxytryptamine (serotonin). PAX, paroxetine; FLX, fluoxetine; FVX, fluvoxamine; SER, sertraline; ESC, escitalopram.
FIGURE 9
FIGURE 9
Effects of SSRIs on IκBα degradation and p38 MAPK phosphorylation induced by a TLR3 agonist in J774.1 murine macrophage cells. J774.1 cells were pre-incubated with each SSRI (10 µM) for 30 min, and then incubated with poly(I:C) (5 μg/ml) for 45 min. The β-actin blot (A,B) or p38 MAPK blot (A,C) is included as a loading control. IκBα degradation or p38 MAPK phosphorylation was analyzed by Western blotting. Error bars indicate ±SE [(B): n = 4, four independent experiments, (C): n = 3, three independent experiments). Statistical analysis was performed by two-way ANOVA followed by Dunnett’s test. Significant differences between poly(I:C) (−) control and test groups are indicated by # p < 0.01. Significant differences between poly(I:C) (+) control and test groups are indicated by *p < 0.05, **p < 0.01. PAX, paroxetine; FLX, fluoxetine; FVX, fluvoxamine; SER, sertraline; ESC, escitalopram.
FIGURE 10
FIGURE 10
Effects of fluoxetine derivatives on cell viability and IL-6 production induced by a TLR3 agonist in J774.1 murine macrophage cells. (A) Structural formulas of fluoxetine and its derivatives. (B,C) J774.1 cells were pre-incubated with each fluoxetine derivative (FLX-D1, -D2, -D3) (1, 10 µM) for 30 min and then incubated with poly(I:C) (5 μg/ml) for 6 h. (B) Cell viability was evaluated by MTT assay. (C) IL-6 was measured by means of ELISA. Error bars indicate ±SE [(B,C): n = 15, four independent experiments). Statistical analysis was performed by one-way ANOVA followed by Dunnett’s test. Significant differences between control and test groups are indicated by ****p < 0.0001. FLX, fluoxetine. D-1: FLX-D1, D-2: FLX-D2, D-3: FLX-D3.

Similar articles

Cited by

References

    1. Briard B., Place D. E., Kanneganti T. D. (2020). DNA Sensing in the Innate Immune Response. Physiol. (Bethesda) 35 (2), 112–124. 10.1152/physiol.00022.2019 - DOI - PMC - PubMed
    1. Chen N., Xia P., Li S., Zhang T., Wang T. T., Zhu J. (2017). RNA Sensors of the Innate Immune System and Their Detection of Pathogens. IUBMB Life 69 (5), 297–304. 10.1002/iub.1625 - DOI - PMC - PubMed
    1. Chen S., Xuan J., Couch L., Iyer A., Wu Y., Li Q. Z., et al. (2014). Sertraline Induces Endoplasmic Reticulum Stress in Hepatic Cells. Toxicology 322, 78–88. 10.1016/j.tox.2014.05.007 - DOI - PMC - PubMed
    1. Chousterman B. G., Swirski F. K., Weber G. F. (2017). Cytokine Storm and Sepsis Disease Pathogenesis. Semin. Immunopathol. 39 (5), 517–528. 10.1007/s00281-017-0639-8 - DOI - PubMed
    1. Crayne C. B., Albeituni S., Nichols K. E., Cron R. Q. (2019). The Immunology of Macrophage Activation Syndrome. Front. Immunol. 10, 119. 10.3389/fimmu.2019.00119 - DOI - PMC - PubMed