. 2022 Jun 17:13:891041.
doi: 10.3389/fphar.2022.891041. eCollection 2022.

Screening of Hydrocarbon-Stapled Peptides for Inhibition of Calcium-Triggered Exocytosis

Affiliations

Screening of Hydrocarbon-Stapled Peptides for Inhibition of Calcium-Triggered Exocytosis

Ying Lai et al. Front Pharmacol. .

Abstract

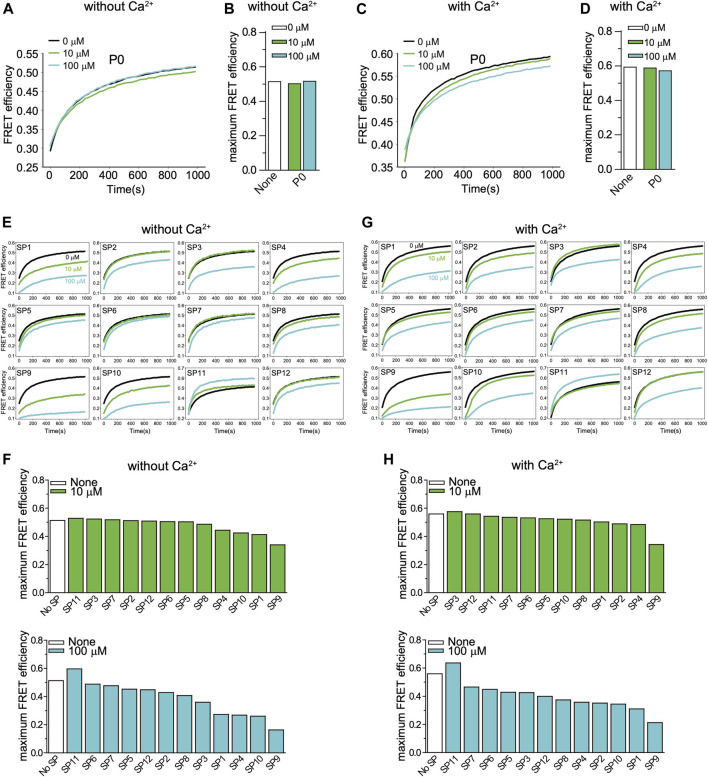
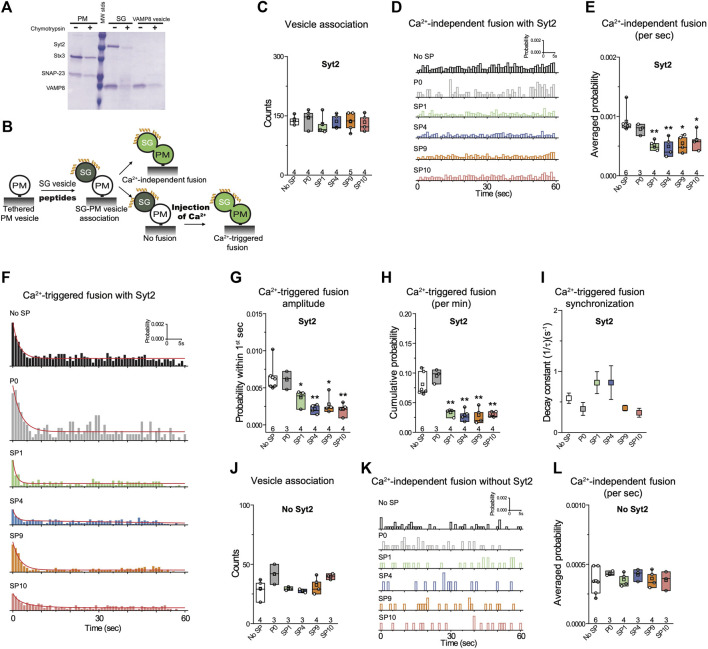
The so-called primary interface between the SNARE complex and synaptotagmin-1 (Syt1) is essential for Ca2+-triggered neurotransmitter release in neuronal synapses. The interacting residues of the primary interface are conserved across different species for synaptotagmins (Syt1, Syt2, Syt9), SNAP-25, and syntaxin-1A homologs involved in fast synchronous release. This Ca2+-independent interface forms prior to Ca2+-triggering and plays a role in synaptic vesicle priming. This primary interface is also conserved in the fusion machinery that is responsible for mucin granule membrane fusion. Ca2+-stimulated mucin secretion is mediated by the SNAREs syntaxin-3, SNAP-23, VAMP8, Syt2, and other proteins. Here, we designed and screened a series of hydrocarbon-stapled peptides consisting of SNAP-25 fragments that included some of the key residues involved in the primary interface as observed in high-resolution crystal structures. We selected a subset of four stapled peptides that were highly α-helical as assessed by circular dichroism and that inhibited both Ca2+-independent and Ca2+-triggered ensemble lipid-mixing with neuronal SNAREs and Syt1. In a single-vesicle content-mixing assay with reconstituted neuronal SNAREs and Syt1 or with reconstituted airway SNAREs and Syt2, the selected peptides also suppressed Ca2+-triggered fusion. Taken together, hydrocarbon-stapled peptides that interfere with the primary interface consequently inhibit Ca2+-triggered exocytosis. Our inhibitor screen suggests that these compounds may be useful to combat mucus hypersecretion, which is a major cause of airway obstruction in the pathophysiology of COPD, asthma, and cystic fibrosis.

Keywords: airway obstruction; asthma; cystic fibrosis; mucin secretion; neurotransmitter release; stapled peptide; stimulated membrane fusion.


Conflict of interest statement

The authors declare that the research was conducted in the absence of any commercial or financial relationships that could be construed as a potential conflict of interest.

Figures

FIGURE 1
FIGURE 1
Design and characterization of stapled peptides. (A) Schematic diagram for stapled peptides synthesis. Hydrocarbon-stapled peptides are formed via cross-linking the residues at the specified positions. P0 is the wildtype sequence for SNAP-25A, residues 37–58. (B) Design of synthesized stapled peptides with varying lengths of olefinic side chains and different positions of the non-natural amino acid substitutions. The superscripts specify the starting and end positions within the SNAP-25A sequence. Sn or Rn indicates S or R stereochemistry at the α-carbon, respectively, n indicates the number of carbon atoms in the olefinic side chains. (C) Close-up view of the primary interface between the neuronal SNARE complex (VAMP-2—blue, Stx1—red, SNAP-25A—green) and the C2B domain of Syt1 (orange) (PDB ID 5W5C), indicating the region (yellow) from which the peptides were chosen. The Cα-positions of the S5 and R7 non-natural amino acid substitutions of all the designs are indicated by purple spheres. (D) CD spectra of the specified peptides measured at 100 mM concentration, pH 7.4, 25 ± 1°C. (E) Percentage of α-helical content of the specified peptides as estimated by dividing the mean residue ellipticity (φ) 222obs by the reported (φ) 222obs for a model helical decapeptide. (F) Size exclusion chromatography (SEC) profiles of the specified peptides. Each peptide was filtered with a 0.2 μm filter and then loaded on a Superdex 75 column in buffer V (20 mM HEPES, pH 7.4, 90 mM NaCl). The dashed line indicates the border of the void volume at ∼8 ml.
FIGURE 2
FIGURE 2
Effect of stapled peptides in ensemble lipid mixing assays with neuronal SNAREs and Syt1. (A) The non-stapled peptide P0 has little effect on Ca2+-independent ensemble lipid mixing measurements of vesicle-vesicle fusion with SV and PM vesicles (Methods). The two groups of vesicles are mixed at the same molar ratio with a final lipid concentration of 0.1 mM. The time traces show FRET efficiency upon mixing dye-labeled neuronal PM- and SV-vesicles (Methods). The black line is a control without peptide. The green and blue lines indicate the lipid mixing experiments with 10 and 100 µM P0, respectively. (B) Corresponding maximum FRET efficiency within the observation period of 1,000 s. (C) P0 has little effect on Ca2+-triggered ensemble lipid mixing measurements of vesicle-vesicle fusion. The two groups of vesicles are mixed at the same molar ratio with a final lipid concentration of 0.1 mM. The time traces show FRET efficiency upon mixing dye-labeled neuronal PM- and SV-vesicles (Methods). The black line is a control without peptide. The green and blue lines represent the reaction with 10 and 100 µM P0, respectively. (D) Corresponding maximum FRET efficiency within the observation period of 1,000 s. (E) Effect of stapled peptides in absence of Ca2+. The two groups of vesicles (SV and PM) were mixed at the same molar ratio with a final lipid concentration of 0.1 mM. The time traces show FRET efficiency upon mixing neuronal dye-labeled PM- and SV-vesicles (Methods). (F) Corresponding maximum FRET efficiency within the observation period of 1,000 s. (G) Effect of stapled peptides in the presence of Ca2+. The two groups of vesicles (SV and PM) were mixed at the same molar ratio with a final lipid concentration of 0.1 mM. The time traces show FRET efficiency upon mixing neuronal PM- and SV-vesicles. (H) Corresponding maximum FRET efficiency within the observation period of 1,000 s.
FIGURE 3
FIGURE 3
Stapled peptides inhibit both Ca2+-independent and Ca2+-triggered content mixing with reconstituted neuronal SNAREs and Syt1. (A) Schematic of the single-vesicle content-mixing assay. Neuronal PM: plasma membrane mimic vesicles with reconstituted Stx1A and SNAP-25A; SV: synaptic vesicle mimic with reconstituted VAMP2 and Syt1. After SV—neuronal PM vesicle association, vesicle pairs either undergo Ca2+-independent fusion or remain associated until fusion is triggered by Ca2+ addition. 10 μM of each specific stapled peptide (yellow) was added together with SV vesicles and was present in all subsequent stages. For details of the reconstitution and lipid compositions, see Methods in (Lai et al., 2022). (B) Effects of stapled peptides on vesicle association. (C) Corresponding Ca2+-independent fusion probabilities. (D) Corresponding average probabilities of Ca2+-independent fusion events per second (left to right: ***p = 0.00044, ***p = 0.00051, ***p = 0.00022, **p = 0.0012). (E) Corresponding Ca2+-triggered fusion probabilities. (F–H) Corresponding Ca2+-triggered fusion amplitudes of the first 1-s time bin upon 500 μM Ca2+-injection (F) (left to right: *p = 0.034, *p = 0.013, *p = 0.017), the cumulative Ca2+-triggered fusion probability within 1 min (G) (left to right: *p = 0.021, *p = 0.039), and the decay rate (1/τ) of the Ca2+-triggered fusion histogram (H). The fusion probabilities and amplitudes were normalized to the number of analyzed neuronal SV—neuronal PM vesicle pairs (Supplementary Table S1). Panels B,D,F,G show box plots and data points for n (indicated below each box plot) independent repeat experiments (Supplementary Table S1): the whiskers show the min and max values (excluding outliers), the box limits are the 25th and 75th percentiles, the square point denotes the mean value, and the center line denotes the median. Decay constants (boxes) and error estimates (bars) in panel H computed from the covariance matrix upon fitting the corresponding histograms combining all repeats with a single exponential decay function using the Levenberg-Marquardt algorithm. *p < 0.05, **p < 0.01, ***p < 0.001 by Student’s t-test, compared to the experiment without the stapled peptides.
FIGURE 4
FIGURE 4
The quintuple Syt1_QM mutant and omission of Syt1 alleviate the inhibitory effects of stapled peptides. (A) Effects of 10 μM of each of the specified peptides on vesicle association. (B) Corresponding Ca2+-independent fusion probabilities. (C) Corresponding average probabilities of Ca2+-independent fusion events per second. (D) Effects of 10 μM of each of the specified peptides on vesicle association (left to right: **p = 0.0016, *p = 0.016, *p = 0.017). (E) Corresponding Ca2+-independent fusion probabilities. (F) Corresponding average probabilities of Ca2+-independent fusion events per second. (G) Corresponding Ca2+-triggered fusion probabilities. (H–J) Corresponding Ca2+-triggered fusion amplitude of the first 1-s time bin upon 500 μM Ca2+-injection (H), the cumulative Ca2+-triggered fusion probability within 1 min (I), and the decay rate (1/τ) of the Ca2+-triggered fusion histogram (J). The fusion probabilities and amplitudes were normalized to the number of analyzed neuronal SV—neuronal PM vesicle pairs (Supplementary Table S1). Panels A,C, D,F,H, I show box plots and data points for n (indicated below each box plot) independent repeat experiments (Supplementary Table S1): the whiskers show the min and max values (excluding outliers), the box limits are the 25th and 75th percentiles, the square point denotes the mean value, and the center line denotes the median. Decay constants (boxes) and error estimates (bars) in panel J computed from the covariance matrix upon fitting the corresponding histograms combining all repeats with a single exponential decay function using the Levenberg-Marquardt algorithm. *p < 0.05, **p < 0.01 by Student’s t-test, compared to the experiment without the stapled peptides.
FIGURE 5
FIGURE 5
Stapled peptides inhibit Ca2+-triggered content mixing with reconstituted airway epithelial SNAREs and Syt2. (A) SDS-PAGE of airway PM and SG vesicles with reconstituted airway SNAREs and Syt2. A chymotrypsin digest was used to determine the proper directionality of the reconstituted membrane proteins. For details of the reconstitution and lipid compositions, see Methods in (Lai et al., 2022). (B) Schematic of the single vesicle content mixing assay. Airway PM: plasma membrane mimic vesicles with reconstituted airway Stx3 and SNAP-23; SG: secretory granule mimics with reconstituted VAMP8 and Syt2. After SG—airway PM vesicle association, vesicle pairs either undergo Ca2+-independent fusion or remain associated until fusion is triggered by Ca2+ addition. 10 μM of each specific stapled peptide (yellow) was added together with SG vesicles and was present during all subsequent stages. (C) Effects of stapled peptides on vesicle association. (D) Corresponding Ca2+-independent fusion probabilities. (E) Corresponding average probabilities of Ca2+-independent fusion events per second (left to right: **p = 0.0062, **p = 0.0082, *p = 0.014, *p = 0.034). (F) Corresponding Ca2+-triggered fusion probabilities. (G–I) Corresponding Ca2+-triggered fusion amplitudes of the first 1-s time bin upon 500 μM Ca2+-injection (G) (left to right: *p = 0.036, **p = 0.0033, *p = 0.012, **p = 0.0037), the cumulative Ca2+-triggered fusion probability within 1 min (H) (left to right: **p = 0.0017, **p = 0.0014, ** 0.0018, **p = 0.0011), and the decay rate (1/τ) of the Ca2+-triggered fusion histogram (I). (J-L) the stapled peptides have no effect on vesicle fusion mediated by airway SNAREs alone. (J) Effects of 10 μM of each of the specified peptides on vesicle association using the assay described above. (K) Corresponding Ca2+-independent fusion probabilities. (L) Corresponding average probabilities of Ca2+-independent fusion events per second. Panels C,E,G,H, J, L show box plots and data points for n (indicated below each box plot) independent repeat experiments (Supplementary Table S1): the whiskers show the min and max values (excluding outliers), the box limits are the 25th and 75th percentiles, the square point denotes the mean value, and the center line denotes the median. Decay constants (boxes) and error estimates (bars) in panel I computed from the covariance matrix upon fitting the corresponding histograms combining all repeats with a single exponential decay function using the Levenberg-Marquardt algorithm. *p < 0.05, **p < 0.01 by Student’s t-test, compared to the experiment without the stapled peptides.

References

    1. Boucher R. C. (2019). Muco-Obstructive Lung Diseases. N. Engl. J. Med. 380, 1941–1953. 10.1056/nejmra1813799 - DOI - PubMed
    1. Brunger A. T., Choi U. B., Lai Y., Leitz J., Zhou Q. (2018). Molecular Mechanisms of Fast Neurotransmitter Release. Annu. Rev. Biophys. 47, 469–497. 10.1146/annurev-biophys-070816-034117 - DOI - PMC - PubMed
    1. Davis C. W., Dickey B. F. (2008). Regulated Airway Goblet Cell Mucin Secretion. Annu. Rev. Physiol. 70, 487–512. 10.1146/annurev.physiol.70.113006.100638 - DOI - PubMed
    1. Diao J., Grob P., Cipriano D. J., Kyoung M., Zhang Y., Shah S., et al. (2012). Synaptic Proteins Promote Calcium-Triggered Fast Transition from Point Contact to Full Fusion. Elife 1, e00109. 10.7554/eLife.00109 - DOI - PMC - PubMed
    1. Fahy J. V., Dickey B. F. (2010). Airway Mucus Function and Dysfunction. N. Engl. J. Med. 363, 2233–2247. 10.1056/NEJMra0910061 - DOI - PMC - PubMed