

Notoginsenoside R1 Regulates Ischemic Myocardial Lipid Metabolism by Activating the AKT/mTOR Signaling Pathway
- PMID: 35814216
- PMCID: PMC9257227
- DOI: 10.3389/fphar.2022.905092
Notoginsenoside R1 Regulates Ischemic Myocardial Lipid Metabolism by Activating the AKT/mTOR Signaling Pathway
Abstract
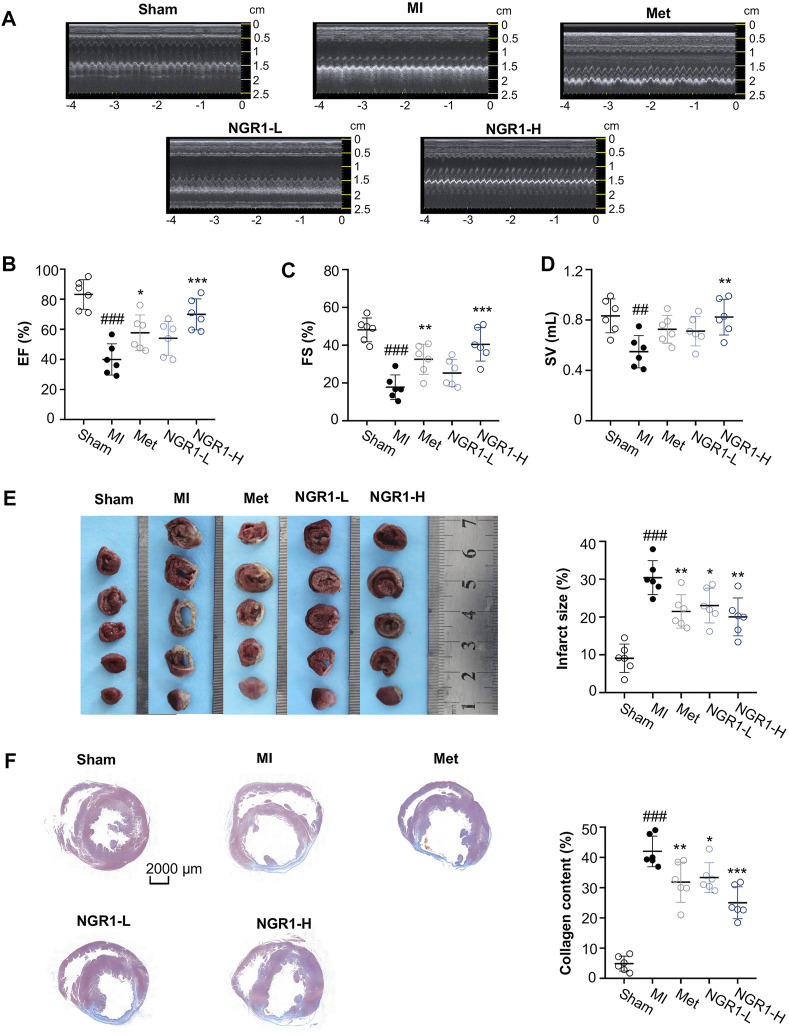
Ischemic heart diseases are responsible for more than one-third of all deaths worldwide. Radix notoginseng is widely used to treat ischemic heart disease in China and other Asian countries, and notoginsenoside R1 (NGR1) is its characteristic and large-amount ingredient. However, the potential molecular mechanisms of NGR1 in improving ischemic heart diseases are unclear. In this study, we combined pharmacological evaluation with network pharmacology, myocardial proteomics, and conventional molecular dynamics (MD) simulation to explore the cardio-protection mechanisms of NGR1. Our results revealed that NGR1 improved the echocardiographic, tissue pathological, and serum biochemical perturbations in myocardial ischemic rats. The network pharmacology studies indicated that NGR1 mainly regulated smooth muscle cell proliferation, vasculature development, and lipid metabolism signaling, especially in the PI3K/AKT pathway. Myocardial proteomics revealed that the function of NGR1 was focused on regulating metabolic and energy supply processes. The research combined reverse-docked targets with differential proteins and demonstrated that NGR1 modulated lipid metabolism in ischemic myocardia by interacting with mTOR and AKT. Conventional MD simulation was applied to investigate the influence of NGR1 on the structural stabilization of the mTOR and AKT complex. The results suggested that NGR1 can strengthen the affinity stabilization of mTOR and AKT. Our study first revealed that NGR1 enhanced the affinity stabilization of mTOR and AKT, thus promoting the activation of the AKT/mTOR pathway and improving lipid metabolic abnormity in myocardial ischemic rats.
Keywords: Akt/mTOR pathway; cardio-protection; ischemic heart disease; lipid metabolism; notoginsenoside R1.
Copyright © 2022 Lei, Yan, Ma, Jiang, Zhang, Zhang and Li.
Conflict of interest statement
The authors declare that the research was conducted in the absence of any commercial or financial relationships that could be construed as a potential conflict of interest.
Figures


Similar articles
-
Notoginsenoside R1-loaded mesoporous silica nanoparticles targeting the site of injury through inflammatory cells improves heart repair after myocardial infarction.Redox Biol. 2022 Aug;54:102384. doi: 10.1016/j.redox.2022.102384. Epub 2022 Jun 24. Redox Biol. 2022. PMID: 35777198 Free PMC article.
-
Protective Effects of Notoginsenoside R1 via Regulation of the PI3K-Akt-mTOR/JNK Pathway in Neonatal Cerebral Hypoxic-Ischemic Brain Injury.Neurochem Res. 2018 Jun;43(6):1210-1226. doi: 10.1007/s11064-018-2538-3. Epub 2018 Apr 25. Neurochem Res. 2018. PMID: 29696512 Free PMC article.
-
Notoginsenoside R1 restrains the proliferation and migration of airway smooth muscle cells isolated from rats with chronic obstructive pulmonary disease.Inhal Toxicol. 2024 Mar;36(3):145-157. doi: 10.1080/08958378.2024.2319708. Epub 2024 Feb 27. Inhal Toxicol. 2024. PMID: 38411938
-
Pharmacological properties and mechanisms of Notoginsenoside R1 in ischemia-reperfusion injury.Chin J Traumatol. 2023 Jan;26(1):20-26. doi: 10.1016/j.cjtee.2022.06.008. Epub 2022 Jul 3. Chin J Traumatol. 2023. PMID: 35922249 Free PMC article. Review.
-
Notoginsenoside R1 for Organs Ischemia/Reperfusion Injury: A Preclinical Systematic Review.Front Pharmacol. 2019 Oct 17;10:1204. doi: 10.3389/fphar.2019.01204. eCollection 2019. Front Pharmacol. 2019. PMID: 31680976 Free PMC article.
Cited by
-
Anti-atherosclerosis mechanisms associated with regulation of non-coding RNAs by active monomers of traditional Chinese medicine.Front Pharmacol. 2023 Nov 6;14:1283494. doi: 10.3389/fphar.2023.1283494. eCollection 2023. Front Pharmacol. 2023. PMID: 38026969 Free PMC article. Review.
-
Plant-derived secondary metabolites and nanotechnology: innovative strategies and emerging challenges in myocardial ischemia-reperfusion injury therapy.Front Pharmacol. 2025 May 29;16:1529478. doi: 10.3389/fphar.2025.1529478. eCollection 2025. Front Pharmacol. 2025. PMID: 40510425 Free PMC article. Review.
-
Notoginsenoside R1 Ameliorate High-Fat-Diet and Vitamin D3-Induced Atherosclerosis via Alleviating Inflammatory Response, Inhibiting Endothelial Dysfunction, and Regulating Gut Microbiota.Drug Des Devel Ther. 2024 May 27;18:1821-1832. doi: 10.2147/DDDT.S451565. eCollection 2024. Drug Des Devel Ther. 2024. PMID: 38845851 Free PMC article.
-
Notoginsenoside R1, a metabolite from Panax notoginseng (Burkill) F.H.Chen, stimulates insulin secretion through activation of phosphatidylinositol 3-kinase (PI3K)/Akt pathway.Front Pharmacol. 2024 Sep 27;15:1478917. doi: 10.3389/fphar.2024.1478917. eCollection 2024. Front Pharmacol. 2024. PMID: 39399466 Free PMC article.
References
-
- Chen Q., Younus M., Thompson J., Hu Y., Hollander J. M., Lesnefsky E. J. (2018). Intermediary Metabolism and Fatty Acid Oxidation: Novel Targets of Electron Transport Chain-Driven Injury during Ischemia and Reperfusion. Am. J. Physiol. Heart Circ. Physiol. 314 (4), H787–H795. 10.1152/ajpheart.00531.2017 - DOI - PMC - PubMed
LinkOut - more resources
Full Text Sources
Molecular Biology Databases
Miscellaneous