. 2022 Jun 23:13:848915.
doi: 10.3389/fphar.2022.848915. eCollection 2022.

Gentiopicroside Ameliorates Diabetic Renal Tubulointerstitial Fibrosis via Inhibiting the AT1R/CK2/NF-κB Pathway

Affiliations

Gentiopicroside Ameliorates Diabetic Renal Tubulointerstitial Fibrosis via Inhibiting the AT1R/CK2/NF-κB Pathway

Zhanchi Xu et al. Front Pharmacol. .

Abstract

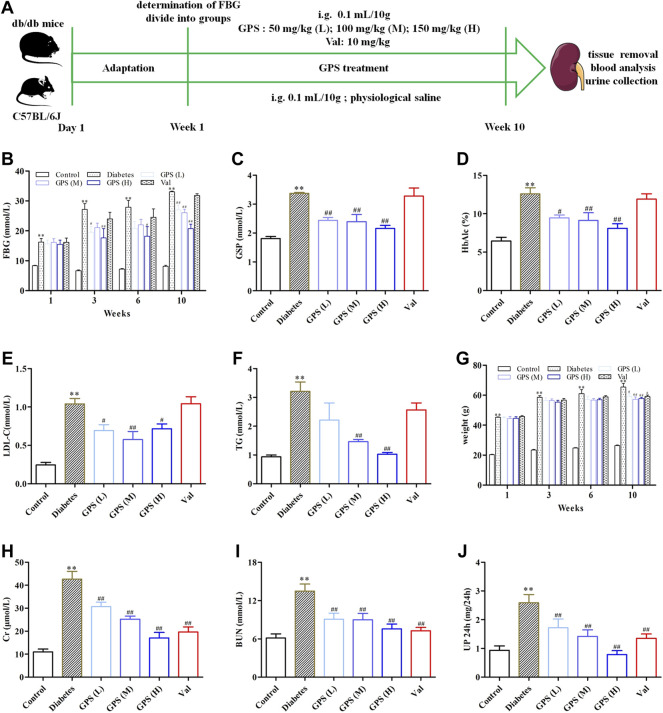
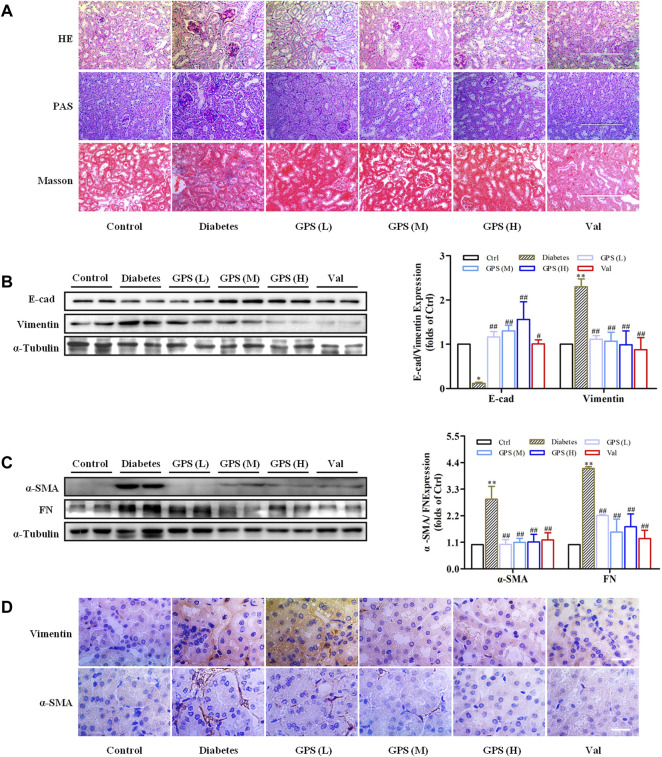
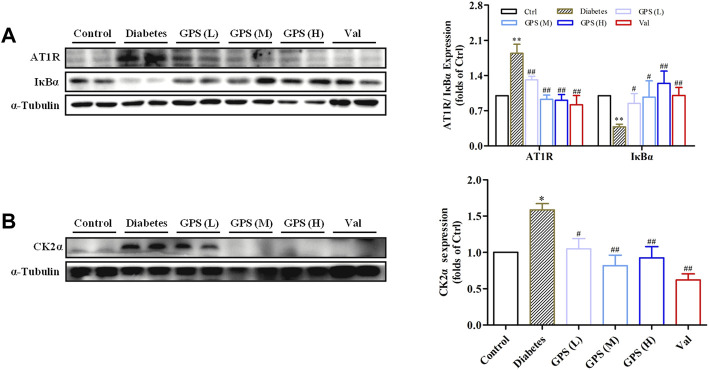
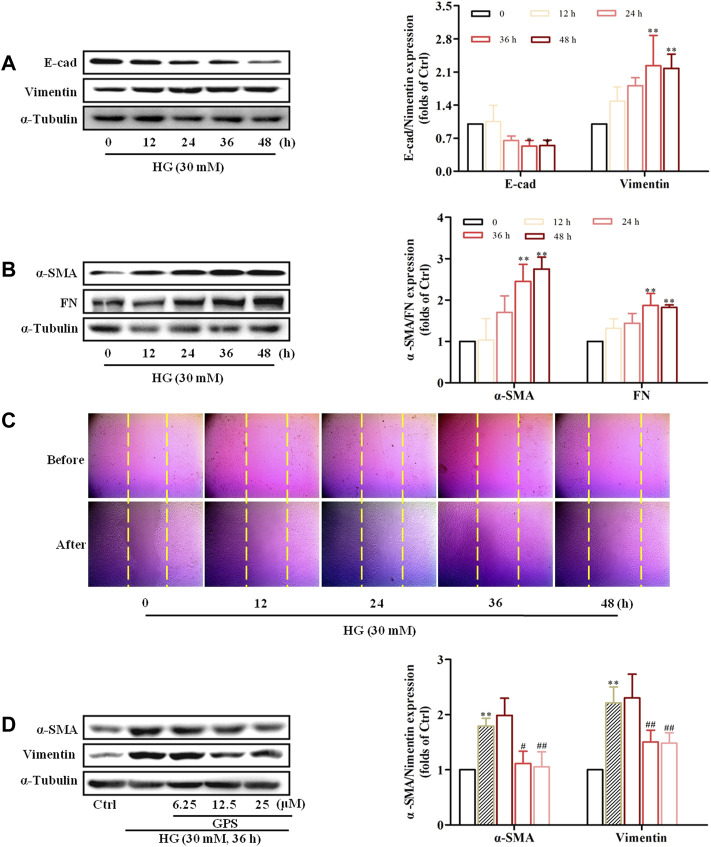
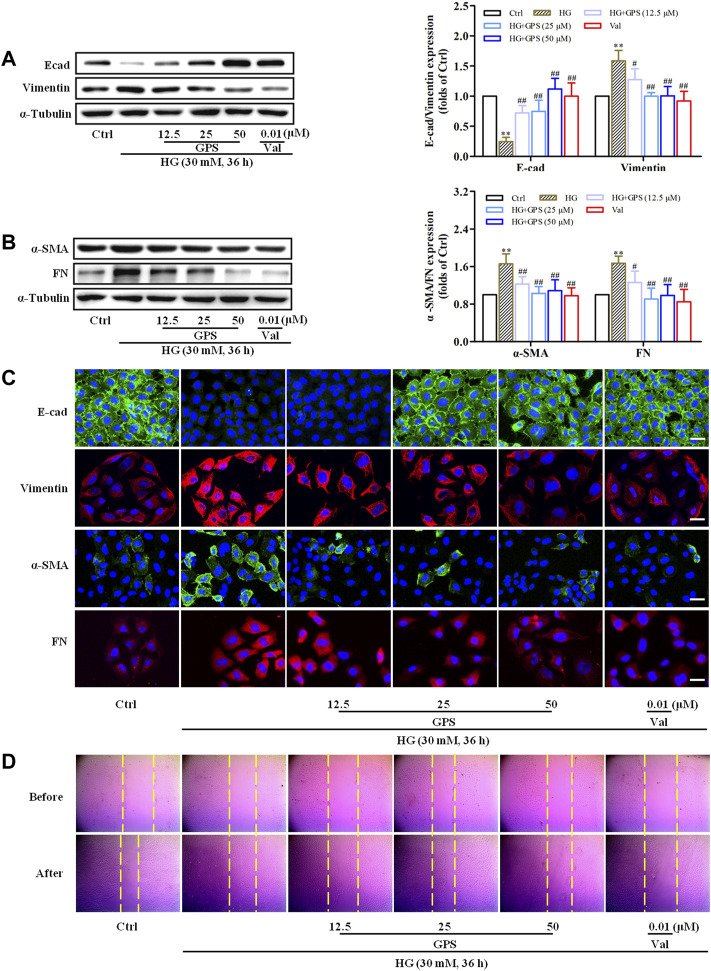
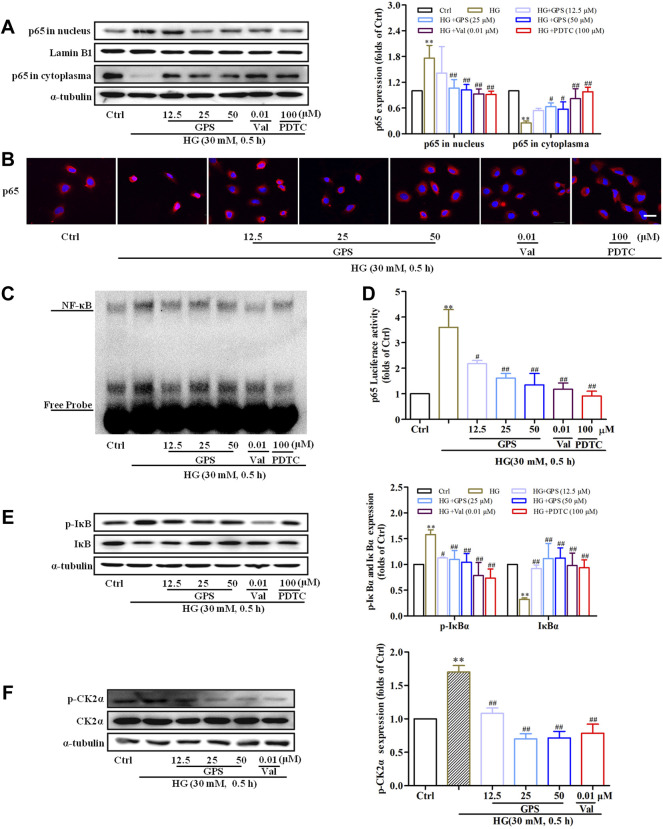
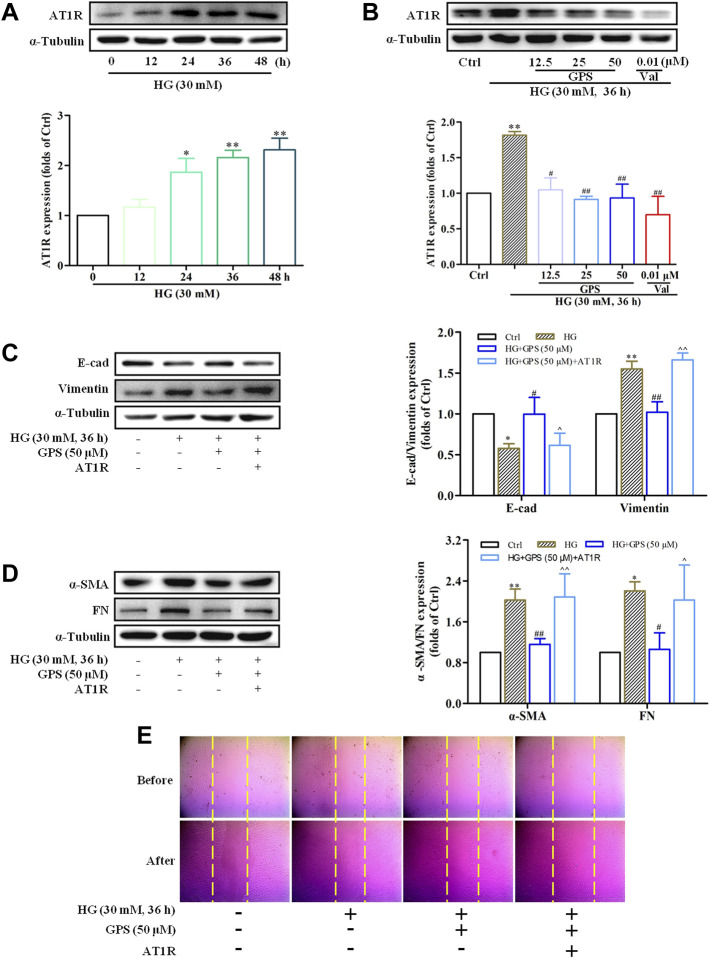
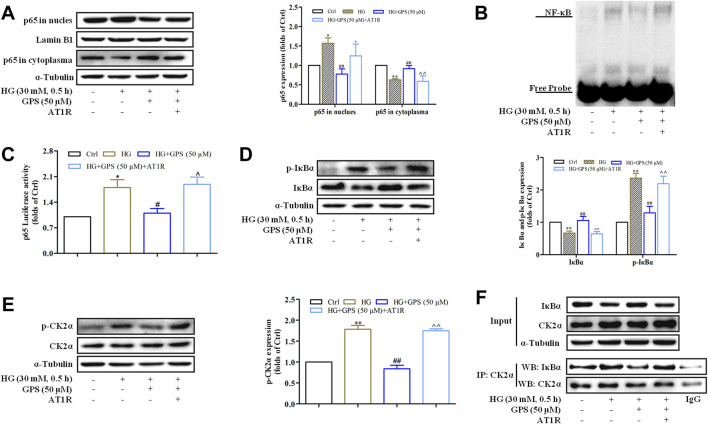
Renal tubulointerstitial fibrosis (TIF), characterized by epithelial-to-mesenchymal transition (EMT) of renal tubular epithelial cells, is the typical pathological alteration in diabetic nephropathy. Gentiopicroside (GPS), a natural compound with anti-inflammatory activity, has been demonstrated to alleviate glomerulosclerosis, whereas whether GPS inhibits TIF via regulating inflammation remains unclear. In this study, diabetic db/db mice and high glucose (HG)-stimulated renal tubular epithelial cells (NRK-52E) were applied to explore the effects and mechanisms of GPS on TIF. The results in vivo showed that GPS effectively improves glycolipid metabolism disorder, renal dysfunction, and TIF. In particular, GPS treatment reversed the abnormal expressions of EMT marker proteins including elevated α-smooth muscle actin and vimentin and decreased E-cadherin in the kidney of db/db mice. Moreover, GPS treatment also inhibited protein expressions of angiotensinⅡ type 1 receptor (AT1R) and CK2α and the activation of the NF-κB pathway. Importantly, the aforementioned effects of GPS acted in vivo were further observed in vitro in HG-stimulated NRK-52E cells, which were independent of its effects on glucose and lipid-lowering activity but were reversed by AT1R over-expression. Together, our results indicate that GPS that directly inhibits the CK2/NF-κB inflammatory signaling pathway via AT1R may also contribute to the amelioration of TIF in diabetes.

Keywords: AT1R; CK2/NF-κB pathway; diabetic nephropathy; gentiopicroside; tubulointerstitial fibrosis.


Conflict of interest statement

The authors declare that the research was conducted in the absence of any commercial or financial relationships that could be construed as a potential conflict of interest.

Figures

FIGURE 1
FIGURE 1
Effects of GPS on blood and urine biochemical parameters of diabetic mice. (A) Process of the experiment in vivo. (B–D) Levels of FBG, GSP, and HbAlc of experimental animals. (E,F) Levels of LDL-C and TG of experimental animals. (G) Body weight of experimental animals. (H–J) Levels of Cr, BUN, and 24 h Up of experimental animals. Data were expressed as means ± SD. n = 8. Diabetes: diabetes group; GPS (L): GPS treatment group (low dose: 50 mg/kg); GPS (M): GPS treatment group (medium dose: 100 mg/kg); GPS (H): GPS treatment group (high dose: 200 mg/kg); Val: valsartan treatment group (10 mg/kg). **p < 0.01 vs. Ctrl. ## p < 0.01 and # p < 0.05 vs. diabetes.
FIGURE 2
FIGURE 2
GPS treatment ameliorated renal fibrosis of diabetic mice. (A) Histopathology analysis of renal tubules by HE (scale bar: 200 μm), PAS (scale bar: 200 μm), and Masson (scale bar: 200 μm) staining. (B,C) Protein levels of E-cad, vimentin, α-SMA, and FN in renal tissues of diabetic mice were detected by Western blot. (D) Protein levels of vimentin and α-SMA in renal tubules of diabetic mice were detected by immunohistochemistry. Scale bar: 25 μm. Data were expressed as mean ± SD. n = 8. **p < 0.01 vs. Ctrl. ## p < 0.01 and # p < 0.05 vs. diabetes.
FIGURE 3
FIGURE 3
GPS inhibited the AT1R/CK2/NF-κB pathway in the kidney tissues of diabetic mice. (A,B) Protein levels of AT1R, IκBα, and CK2α in renal tissues of diabetic mice were detected by Western blot. Data were expressed as mean ± SD. n = 8. **p < 0.01 vs. Ctrl. ## p < 0.01 and # p < 0.05 vs. diabetes.
FIGURE 4
FIGURE 4
HG-induced EMT in NRK-52E cells and GPS inhibited HG-induced EMT in NRK-52E cells starting at 12.5 μM. (A,B) Protein levels of E-cad, vimentin, α-SMA, and FN under the HG conditions at various times were detected by Western blot. **p < 0.01 and *p < 0.05 vs. 0 h. (C) Migration ability of NRK-52E cells under the HG conditions at various times was detected by a cell scratch test. **p < 0.01 and *p < 0.05 vs. 0 h. (D) Protein levels of α-SMA and vimentin after GPS intervention were detected by Western blot. **p < 0.01 vs. Ctrl, ## p < 0.01 vs. HG. Data were expressed as mean ± SD.
FIGURE 5
FIGURE 5
GPS inhibited HG-induced EMT in NRK-52E cells. (A,B) Protein levels of E-cad, vimentin, α-SMA, and FN after GPS intervention were detected by Western blot. (C) Protein levels of E-cad, vimentin, α-SMA, and FN after GPS intervention were detected by immunofluorescence. Scale bar: 20 μm. (D) Migration ability of NRK-52E cells after GPS intervention was detected by a cell scratch test. **p < 0.01 vs. Ctrl, ## p < 0.01 and # p < 0.05 vs. HG. Data were expressed as mean ± SD.
FIGURE 6
FIGURE 6
GPS inhibited HG-induced activation of the CK2/NF-κB pathway in NRK-52E cells. (A) Effects of GPS on p65 distribution in the nucleus and cytoplasm were detected by Western blot. **p < 0.01 vs. Ctrl. ## p < 0.01 and # p < 0.05 vs. HG. (B) Effects of GPS on p65 distribution in the nucleus and cytoplasm were detected by immunofluorescence. Scale bar: 20 μm. (C) Effect of GPS on the NF-κB p65 DNA binding activity was detected by EMSA. (D) Effect of GPS on the NF-κB p65 transcriptional activity was detected by luciferase reporter assay. **p < 0.01 vs. Ctrl. ## p < 0.01 and # p < 0.05 vs. HG. (E,F) Protein levels of IκBα, p-IκBα, and p-CK2α after GPS intervention were detected by Western blot. **p < 0.01 and *p < 0.05 vs. Ctrl. ## p < 0.01 and # p < 0.05 vs. HG. **p < 0.01 vs. Ctrl. ## p < 0.01 and # p < 0.05 vs. HG. Data were expressed as mean ± SD.
FIGURE 7
FIGURE 7
GPS downregulated the protein level of AT1R, and AT1R over-expression reversed the effect of GPS on EMT in HG-induced NRK-52E cells. (A) Expressions of AT1R under the HG conditions at various times were detected by Western blot. **p < 0.01 and *p < 0.05 vs. 0 h. (B) Protein level of AT1R after GPS intervention was detected by Western blot. **p < 0.01 vs. Ctrl. ## p < 0.01 and # p < 0.05 vs. HG. (C,D) Effects of GPS on E-cad, vimentin, α-SMA, and FN expression after AT1R over-expression were detected by Western blot. **p < 0.01 vs. Ctrl. ## p < 0.01 and # p < 0.05 vs. HG. ^^p < 0.05 vs. HG with GPS. (E) Effect of GPS on the migration ability after the AT1R over-expression was detected by the cell scratch test. Data were expressed as mean ± SD.
FIGURE 8
FIGURE 8
AT1R over-expression reversed the effect of GPS on regulating the CK2/NF-κB pathway. (A) Effects of GPS on p65 distribution in the nucleus and cytoplasm after AT1R over-expression were detected by Western blot. (B) Effects of GPS on the DNA NF-κB p65 binding activity after the AT1R over-expression were detected by EMSA. (C) Effect of GPS on the NF-κB p65 transcriptional activity after the AT1R over-expression was detected by luciferase reporter assay. (D,E) Effects of GPS on protein expressions of p-IκBα, IκBα, and p-CK2α after AT1R over-expression was detected by Western blot. (F) Binding of CK2α and IκBα in NRK-52E was detected by immunoprecipitation. **p < 0.01 and *p < 0.05 vs. Ctrl. ## p < 0.01 and # p < 0.05 vs. HG. ^^p < 0.01 and ^p < 0.05 vs. HG with GPS. Data were expressed as mean ± SD.

Similar articles

Cited by

References

    1. Adelusi T. I., Du L., Hao M., Zhou X., Xuan Q., Apu C., et al. (2020). Keap1/Nrf2/ARE Signaling Unfolds Therapeutic Targets for Redox Imbalanced-Mediated Diseases and Diabetic Nephropathy. Biomed. Pharmacother. 123, 109732. 10.1016/j.biopha.2019.109732 - DOI - PubMed
    1. Amorim R. G., Guedes G. d. S., Vasconcelos S. M. d. L., Santos J. C. d. F. (2019). Kidney Disease in Diabetes Mellitus: Cross-Linking between Hyperglycemia, Redox Imbalance and Inflammation. Arq. Bras. Cardiol. 112 (5), 577–587. 10.5935/abc.20190077 - DOI - PMC - PubMed
    1. Azushima K., Gurley S. B., Coffman T. M. (2017). Modelling Diabetic Nephropathy in Mice. Nat. Rev. Nephrol. 14, 48–56. 10.1038/nrneph.2017.142 - DOI - PubMed
    1. Boor P., Celec P., Behuliak M., Grancic P., Kebis A., Kukan M., et al. (2009). Regular Moderate Exercise Reduces Advanced Glycation and Ameliorates Early Diabetic Nephropathy in Obese Zucker Rats. Metabolism 58, 1669–1677. 10.1016/j.metabol.2009.05.025 - DOI - PubMed
    1. Cantero-Navarro E., Fernández-Fernández B., Ramos A. M., Rayego-Mateos S., Rodrigues-Diez R. R., Sánchez-Niño M. D., et al. (2021). Renin-angiotensin System and Inflammation Update. Mol. Cell Endocrinol. 529, 111254. 10.1016/j.mce.2021.111254 - DOI - PubMed