. 2022 Jun 24:13:891802.
doi: 10.3389/fphar.2022.891802. eCollection 2022.

Yu-Ping-Feng Formula Ameliorates Alveolar-Capillary Barrier Injury Induced by Exhausted-Exercise via Regulation of Cytoskeleton

Affiliations

Yu-Ping-Feng Formula Ameliorates Alveolar-Capillary Barrier Injury Induced by Exhausted-Exercise via Regulation of Cytoskeleton

Di Wang et al. Front Pharmacol. .

Abstract

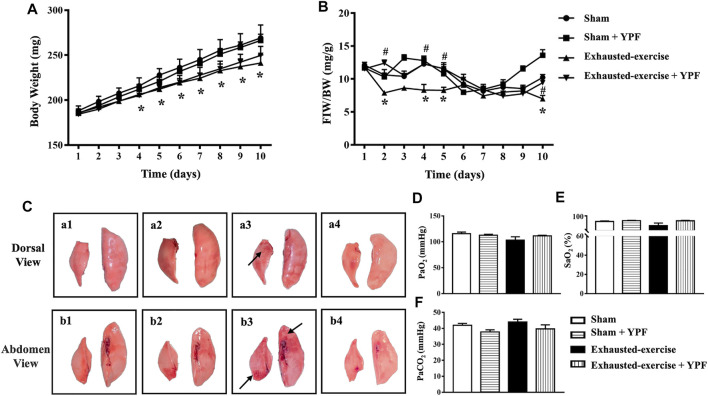
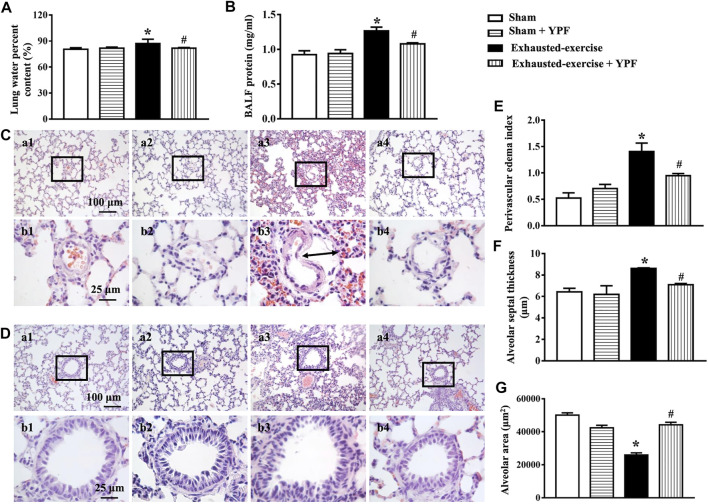
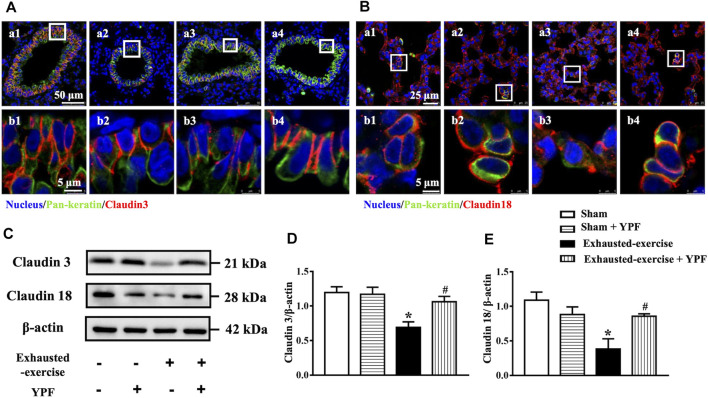
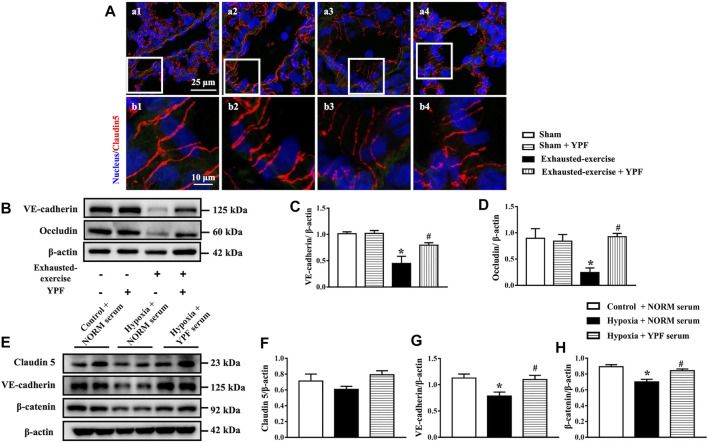
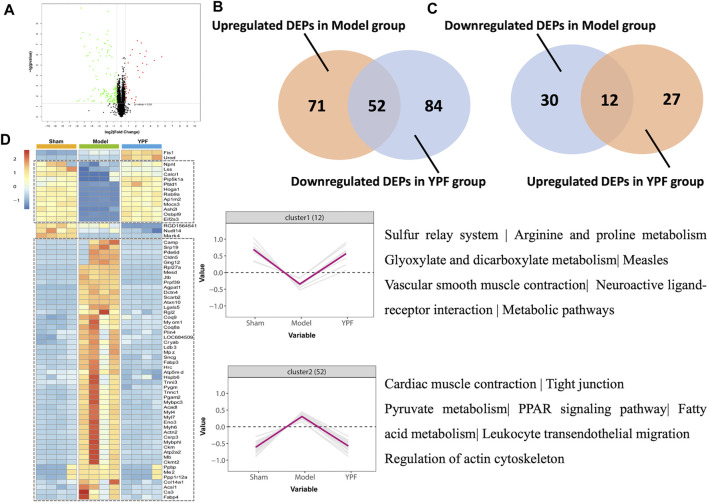
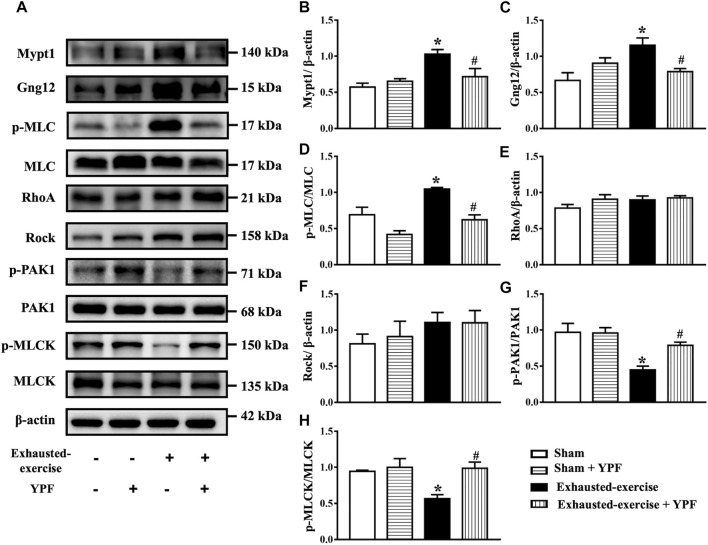
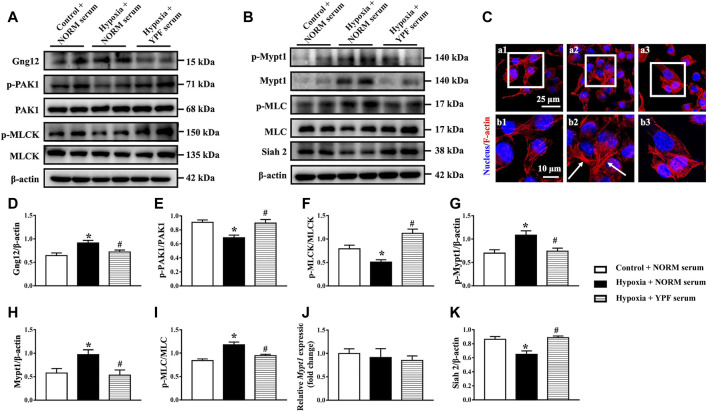
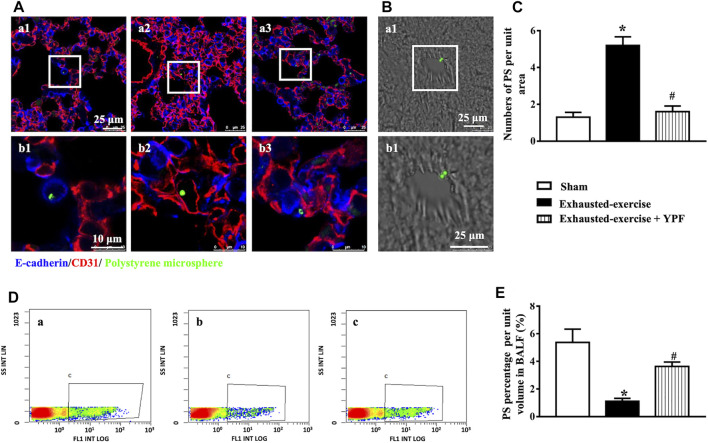
Background: Yu-ping-feng powder (YPF) is a compound traditional Chinese medicine extensively used in China for respiratory diseases. However, the role of YPF in alveolar-capillary barrier dysfunction remains unknown. This study aimed to explore the effect and potential mechanism of YPF on alveolar-capillary barrier injury induced by exhausted exercise. Methods: Male Sprague-Dawley rats were used to establish an exhausted-exercise model by using a motorized rodent treadmill. YPF at doses of 2.18 g/kg was administrated by gavage before exercise training for 10 consecutive days. Food intake-weight/body weight, blood gas analysis, lung water percent content, BALF protein concentration, morphological observation, quantitative proteomics, real-time PCR, and Western blot were performed. A rat pulmonary microvascular endothelial cell line (PMVEC) subjected to hypoxia was applied for assessing the related mechanism. Results: YPF attenuated the decrease of food intake weight/body weight, improved lung swelling and hemorrhage, alleviated the increase of lung water percent content and BALF protein concentration, and inhibited the impairment of lung morphology. In addition, YPF increased the expression of claudin 3, claudin 18, occludin, VE-cadherin, and β-catenin, attenuated the epithelial and endothelial hyperpermeability in vivo and/or in vitro, and the stress fiber formation in PMVECs after hypoxia. Quantitative proteomics discovered that the effect of YPF implicated the Siah2-ubiquitin-proteasomal pathway, Gng12-PAK1-MLCK, and RhoA/ROCK, which was further confirmed by Western blot. Data are available via ProteomeXchange with identifier PXD032737. Conclusion: YPF ameliorated alveolar-capillary barrier injury induced by exhausted exercise, which is accounted for at least partly by the regulation of cytoskeleton.

Keywords: cell junctions; lung injury; proteomics; stress fiber; traditional Chinese medicine.


Conflict of interest statement

The authors declare that the research was conducted in the absence of any commercial or financial relationships that could be construed as a potential conflict of interest.

Figures

FIGURE 1
FIGURE 1
YPF prevents the reduction in food-intake weight (FIW)/body weight (BW) and improves changes in the lung macro morphology induced by exhausted exercise. (A)Alteration of BW with time in four groups. (B) Change in FIW/BW with time in four groups. Values are means ± SEM from eight animals. * p < 0.05 vs. sham; #p < 0.05 vs. exhausted-exercise. (C) Representative images of lung macro morphology in four groups. Arrows: swollen and hemorrhage area. (a1, b1) Sham group; (a2, b2) sham + YPF group; (a3, b3) exhausted-exercise group; and (a4, b4) exhausted-exercise + YPF group. (D) Partial arterial pressure of oxygen. (E) Saturation of arterial blood oxygen. (F) Partial arterial pressure of carbon dioxide. Results are presented as means ± SEM (n = 6).
FIGURE 2
FIGURE 2
YPF attenuates lung edema and the morphological alteration induced by exhausted exercise. (A) Lung water percent content in different groups. (B) BALF protein concentration in different groups. (C) Representative H&E staining images of rat lung microvessels, alveolar space, and alveolar septum. (D) Representative H&E staining images of rat terminal bronchioles. (a1, b1) Sham group; (a2, b2) sham + YPF group; (a3, b3) exhausted-exercise group; and (a4, b4) exhausted-exercise + YPF group. Upper scale bar = 100 μM, the amplified multiple is 100×; lower scale bar = 25 μM, the amplified multiple is 400×. The arrow indicates perivascular edema. (E) Perivascular edema index. (F) Quantitative data for alveolar septal thickness. (G) Quantitative data for the alveolar area. Results are presented as means ± SEM (n = 8 in A and B, and n = 4 in E–G. * p < 0.05 vs. sham; #p < 0.05 vs. exhausted-exercise.
FIGURE 3
FIGURE 3
YPF maintains the integrity of cell junctions in the pulmonary epithelium. (A) Representative immunofluorescent staining images of claudin 3 in the lung tracheal epithelium. Claudin 3 (red) localized between the epithelial cells with marker E-cadherin (green). Nuclei stained blue. (a1, b1) Sham group; (a2, b2) sham + YPF group; (a3, b3) exhausted-exercise group; and (a4, b4) exhausted-exercise + YPF group. Upper scale bar = 50 μM; lower scale bar = 5 μM. (B)Representative immunofluorescent staining images of claudin 18 in the alveolar epithelium. Claudin 18 (red) localized between the epithelial cells with marker E-cadherin (green) and nuclei stained blue. (a1, b1) Sham group; (a2, b2) sham + YPF group; (a3, b3) exhausted-exercise group; and (a4, b4) exhausted-exercise + YPF group. Upper scale bar = 25 μM; lower scale bar = 5 μM. (C)Representative Western bands of claudin 3 and claudin 18. β-Actin was used as a loading control; n = 4. (D–E) Depicted in D and E are the semiquantitative analyses of claudin 3 and claudin 18, respectively. Results are presented as means ± SEM (n = 4). * p < 0.05 vs. sham; #p < 0.05 vs. exhausted-exercise.
FIGURE 4
FIGURE 4
YPF maintains the integrity of cell junctions in the pulmonary endothelium and the effect of YPF serum on pulmonary microvascular cells. (A)Representative immunofluorescent staining images of claudin 5 in lung microvascular. Claudin 5 stained red and nuclei stained blue. (a1, b1) Sham group; (a2, b2) sham + YPF group; (a3, b3) exhausted-exercise group; and (a4, b4) exhausted-exercise + YPF group. Upper scale bar = 25 μM; lower scale bar = 10 μM. (B)Representative Western bands of VE-cadherin and occludin in lung tissue. (C) and (D) Semi-quantitative analysis of VE-cadherin and occludin. Results are presented as means ± SEM (n = 4). (E) Representative Western bands of claudin 5, VE-cadherin, and β-catenin in PMVECs. (F–H)Semi-quantitative analysis of claudin 5, VE-cadherin, and β-catenin. Results are presented as means ± SEM (n = 6). * p < 0.05 vs. control + NORM serum; #p < 0.05 vs. hypoxia + NORM serum.
FIGURE 5
FIGURE 5
Quantitative proteomic study on rat lung tissue. (A)Volcano plot of differentially expressed proteins (DEPs) identified between the exhausted-exercise group and the exhausted-exercise + YPF group. Red dots: represent upregulated DEPs; green dots: represent downregulated DEPs; and black dots: represent unchanged proteins. (B) Venn diagram of significantly changed proteins in upregulated DEPs of the exhausted-exercise group and downregulated DEPs of the exhausted-exercise group + YPF group with 52 proteins in intersection area. (C) Venn diagram of significantly changed proteins in downregulated DEPs of the exhausted-exercise group and upregulated DEPs of the exhausted-exercise group + YPF group with 12 proteins in the intersection area. (D) Heatmap of adjusting DEPs by YPF. The color bar represents the fold change from increasing to decreasing of all proteins identified in each group. Hierarchical clusters show a clear group differentiation according to similarity. Numbers of proteins and selected enriched KEGG pathways are indicated for marked clusters.
FIGURE 6
FIGURE 6
YPF attenuates the alteration of MLC and related signaling proteins after exhausted exercise. (A)Representative Western bands of Mypt1, Gng12, p-MLC, MLC, RhoA, Rock, p-PAK1, PAK1, p-MLCK, and MLCK. (B–H)Semi-quantitative analysis of (B) Mypt1, (C) Gng12 (D) p-MLC/MLC, (E) RhoA, (F) Rock, (G), p-PAK1/PAK1, and (H) p-MLCK/MLCK . Results are presented as means ± SEM (n = 4). * p < 0.05 vs. sham; #p < 0.05 vs. exhausted-exercise.
FIGURE 7
FIGURE 7
YPF serum attenuates the alteration of MLC and related signaling proteins in PMVECs. (A)Representative Western bands of Gng12, p-PAK1, PAK1, p-MLCK, and MLCK. (B)Representative Western bands of p-Mypt1, Mypt1, p-MLC, MLC, and Siah2. (C)Representative F-actin staining images (red) in PMVECs. Nuclei stained blue. Arrows: stress fibers. (a1,b1) Control + NORM serum; (a2,b2) hypoxia + NORM serum; and (a3, b3) Hypoxia + YPF serum. Upper scale bar = 25 μM; lower scale bar = 10 μM. (D–I)Semi-quantitative analysis of (D) Gng12, (E) p-PAK1/PAK1, (F) p-MLCK/MLCK, (G) p-Mypt1, (H) Mypt1, and (I) p-MLC/MLC . Results are presented as means ± SEM (n = 6). (J) mRNA expression of Mypt1; n = 8. (K) Semi-quantitative analysis of Siah2. Results are presented as means ± SEM (n = 6). * p < 0.05 vs. control + NORM serum; #p < 0.05 vs. hypoxia + NORM serum.
FIGURE 8
FIGURE 8
Integrity of the alveolar-capillary barrier evaluated by intratracheal instillation of the polystyrene microsphere. (A)Representative immunofluorescent staining images of lung tissue. The microvessel was marked by CD31 as red and alveoli were marked by E-cadherin as blue. Green dots represent the polystyrene microsphere. (a1, b1) Sham group; (a2, b2) exhausted-exercise group; and (a3, b3) exhausted-exercise + YPF group. Upper scale bar = 25 μM; lower scale bar = 10 μM. (B) Light field of liver tissue. Green dots represent the polystyrene microsphere. (a1, b1) Exhausted-exercise group. Scale bar = 25 μM. (C)Number of polystyrene microspheres per unit area in liver tissue sections. Results are presented as means ± SEM (n = 3). (D) Representative image of flow cytometry. (a) Sham group; (b) exhausted-exercise group; and (c) exhausted-exercise + YPF group. (E)Percentage of polystyrene microspheres per volume in BALF. Results are presented as means ± SEM (n = 4). * p < 0.05 vs. sham; #p < 0.05 vs. exhausted-exercise.

Similar articles

Cited by

References

    1. Aguilar H. N., Tracey C. N., Tsang S. C., McGinnis J. M., Mitchell B. F. (2011). Phos-Tag-Based Analysis of Myosin Regulatory Light Chain Phosphorylation in Human Uterine Myocytes. PLoS One 6 (6), e20903. 10.1371/journal.pone.0020903 - DOI - PMC - PubMed
    1. Asano T., Morishita R., Ueda H., Asano M., Kato K. (1998). GTP-Binding Protein Gamma12 Subunit Phosphorylation by Protein Kinase C-Iidentification of the Phosphorylation Site and Factors Involved in Cultured Cells and Rat Tissues In Vivo . Eur. J. Biochem. 251 (1-2), 314–319. 10.1046/j.1432-1327.1998.2510314.x - DOI - PubMed
    1. Caillaud C., Serre-Cousiné O., Anselme F., Capdevilla X., Préfaut C. (1995). Computerized Tomography and Pulmonary Diffusing Capacity in Highly Trained Athletes after Performing a Triathlon. J. Appl. Physiol. 79 (4), 1226–1232. 10.1152/jappl.1995.79.4.1226 - DOI - PubMed
    1. Cheng X. D., Wei M. G. (2014). Profiling the Metabolism of Astragaloside IV by Ultra Performance Liquid Chromatography Coupled with Quadrupole/Time-Of-Flight Mass Spectrometry. Molecules 19 (11), 18881–18896. 10.3390/molecules191118881 - DOI - PMC - PubMed
    1. Deutsch E. W., Bandeira N., Sharma V., Perez-Riverol Y., Carver J. J., Kundu D. J., et al. (2020). The ProteomeXchange Consortium in 2020: Enabling 'Big Data' Approaches in Proteomics. Nucleic Acids Res. 48 (D1), D1145–D1152. 10.1093/nar/gkz984 - DOI - PMC - PubMed