

Nrf2 Knockout Affected the Ferroptosis Signaling Pathway against Cisplatin-Induced Hair Cell-Like HEI-OC1 Cell Death
- PMID: 35814275
- PMCID: PMC9270153
- DOI: 10.1155/2022/2210733
Nrf2 Knockout Affected the Ferroptosis Signaling Pathway against Cisplatin-Induced Hair Cell-Like HEI-OC1 Cell Death
Abstract
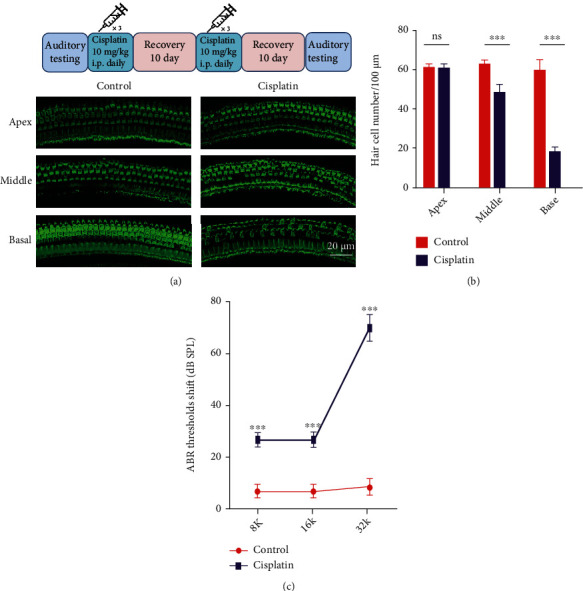
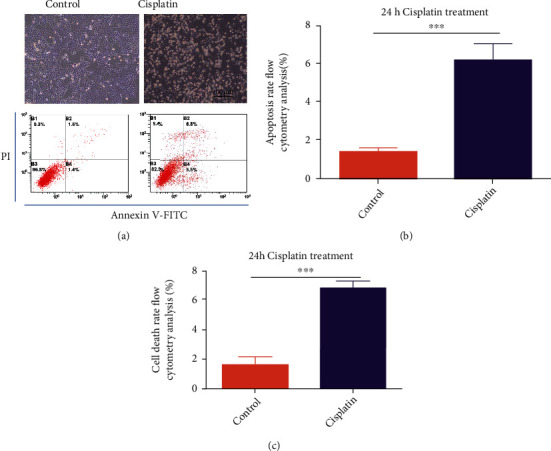
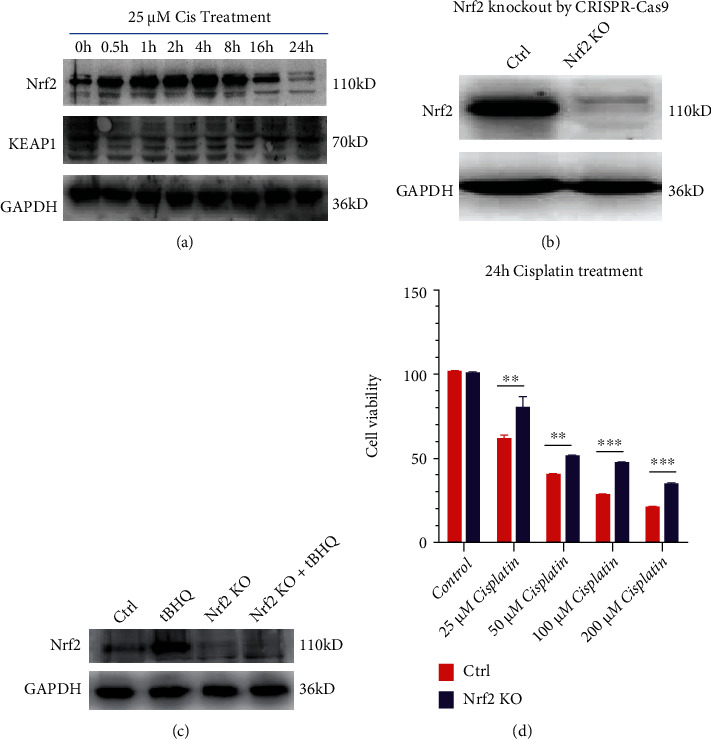
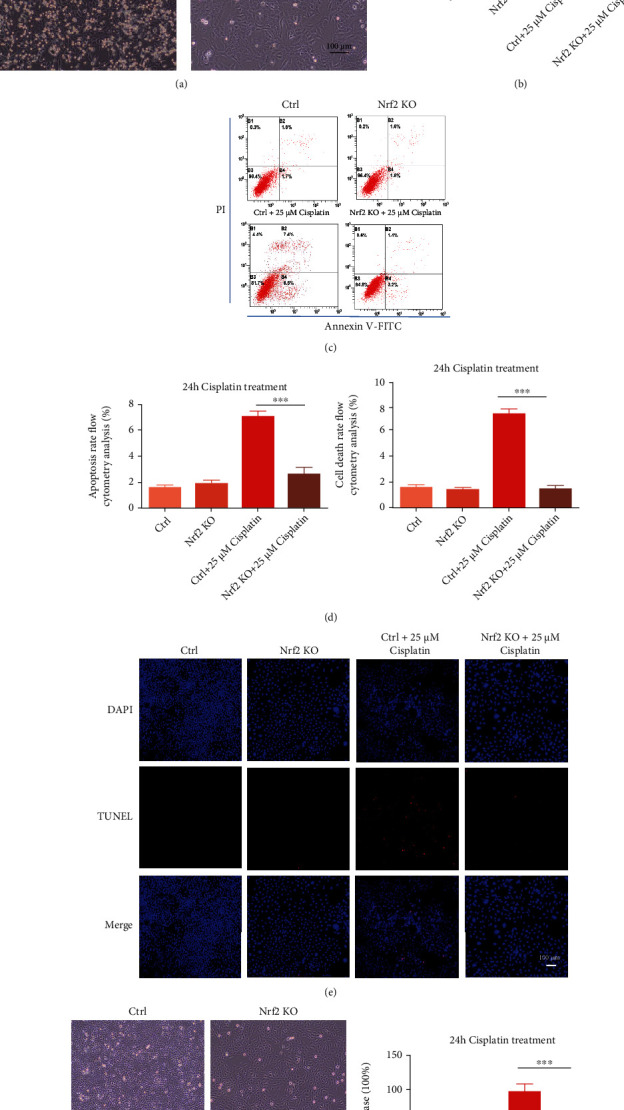
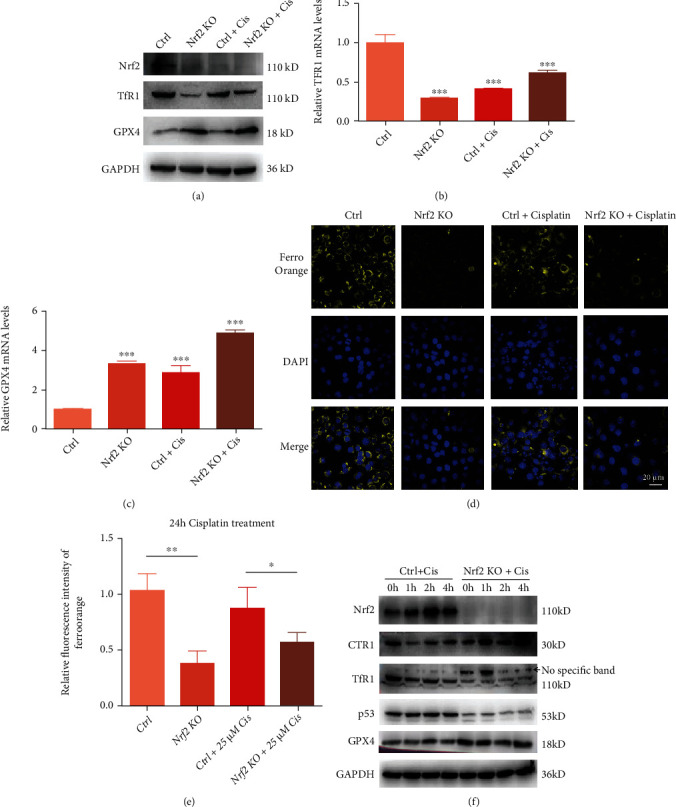
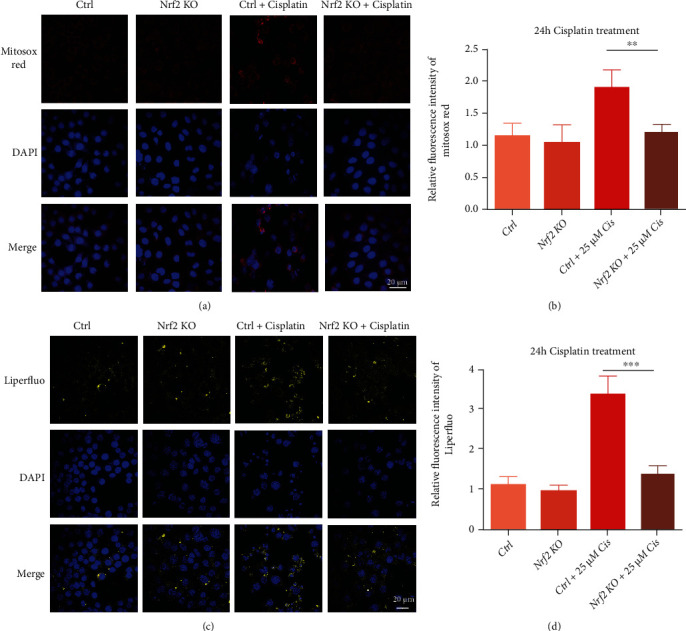
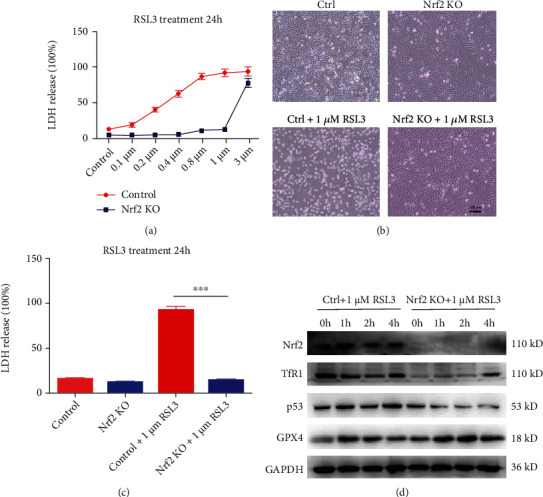
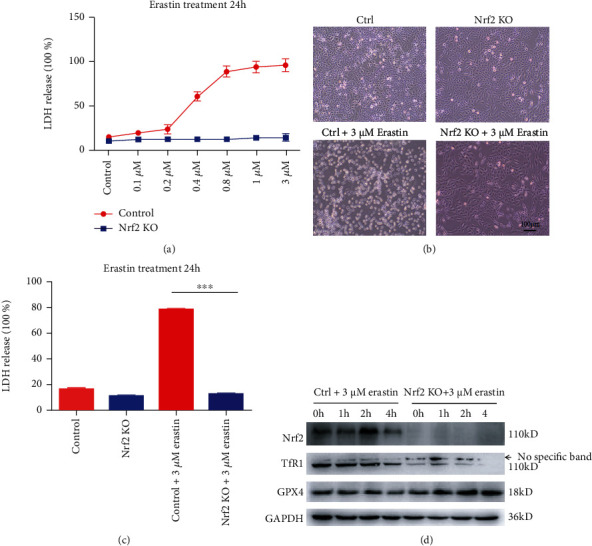
Cisplatin is a well-known and widely used anticancer drug with high therapeutic efficacy in solid tumors; however, side effects are common with its use. Because cisplatin can be retained in the cochlea, ototoxicity leading to hearing loss limits its clinical applications. Here, we report that Nrf2 knockout (KO) strongly increased cisplatin resistance in HEI-OC1 cells, which are immortalized cells from the murine organ of Corti. The underlying mechanism of this phenomenon was uncovered, and an important novel therapeutic target for combating cisplatin-induced hearing loss was identified. Preliminary investigations determined that Nrf2 KO markedly decreased TfR1 protein levels and increased GPX4 protein levels. Thus, ferroptosis may protect organisms from cisplatin-induced cell death. Furthermore, Nrf2 KO cells were resistant to the classical ferroptosis inducers RSL3 and erastin, providing solid evidence that Nrf2 KO inhibits ferroptosis and that knocking out Nrf2 may be a new clinical strategy to prevent cisplatin-induced hearing loss.
Copyright © 2022 Weilong Wang et al.
Conflict of interest statement
The authors declare that they have no competing interests.
Figures
Similar articles
-
4-octyl itaconate alleviates cisplatin-induced ferroptosis possibly via activating the NRF2/HO-1 signalling pathway.J Cell Mol Med. 2024 Apr;28(7):e18207. doi: 10.1111/jcmm.18207. J Cell Mol Med. 2024. PMID: 38506087 Free PMC article.
-
Inhibition of Gpx4-mediated ferroptosis alleviates cisplatin-induced hearing loss in C57BL/6 mice.Mol Ther. 2024 May 1;32(5):1387-1406. doi: 10.1016/j.ymthe.2024.02.029. Epub 2024 Feb 27. Mol Ther. 2024. PMID: 38414247 Free PMC article.
-
Paeoniflorin attenuates cisplatin induced ototoxicity by inhibiting ferroptosis mediated by HMGB1/NRF2/GPX4 pathway.Food Chem Toxicol. 2025 Aug;202:115550. doi: 10.1016/j.fct.2025.115550. Epub 2025 May 13. Food Chem Toxicol. 2025. PMID: 40374000
-
Cisplatin-induced ototoxicity: Updates on molecular mechanisms and otoprotective strategies.Eur J Pharm Biopharm. 2021 Jun;163:60-71. doi: 10.1016/j.ejpb.2021.03.008. Epub 2021 Mar 26. Eur J Pharm Biopharm. 2021. PMID: 33775853 Review.
-
Astragaloside IV regulates the ferroptosis signaling pathway via the Nrf2/SLC7A11/GPX4 axis to inhibit PM2.5-mediated lung injury in mice.Int Immunopharmacol. 2022 Nov;112:109186. doi: 10.1016/j.intimp.2022.109186. Epub 2022 Sep 15. Int Immunopharmacol. 2022. PMID: 36115280 Review.
Cited by
-
Studies on the mechanism of ototoxic action of cisplatin and the antagonistic effect of polyphenolic compounds.Front Pharmacol. 2025 Apr 25;16:1586243. doi: 10.3389/fphar.2025.1586243. eCollection 2025. Front Pharmacol. 2025. PMID: 40351440 Free PMC article. Review.
-
Hearing loss during chemotherapy: prevalence, mechanisms, and protection.Am J Cancer Res. 2024 Sep 25;14(9):4597-4632. doi: 10.62347/OKGQ4382. eCollection 2024. Am J Cancer Res. 2024. PMID: 39417180 Free PMC article. Review.
-
Cisplatin ototoxicity mechanism and antagonistic intervention strategy: a scope review.Front Cell Neurosci. 2023 Jun 1;17:1197051. doi: 10.3389/fncel.2023.1197051. eCollection 2023. Front Cell Neurosci. 2023. PMID: 37323582 Free PMC article. Review.
-
Development of the inner ear and regeneration of hair cells after hearing impairment.Fundam Res. 2023 Nov 21;5(1):203-214. doi: 10.1016/j.fmre.2023.09.005. eCollection 2025 Jan. Fundam Res. 2023. PMID: 40166090 Free PMC article. Review.
-
Induction of cell death by sodium hexachloroplatinate (IV) in the HEI-OC1 cell line, primary rat spiral ganglion cells and rat organ of Corti explants.PLoS One. 2024 Jul 26;19(7):e0307973. doi: 10.1371/journal.pone.0307973. eCollection 2024. PLoS One. 2024. PMID: 39058727 Free PMC article.
References
-
- Knight K. R., Chen L., Freyer D., et al. Group-wide, prospective study of ototoxicity assessment in children receiving cisplatin chemotherapy (ACCL05C1): a report from the children’s oncology group. Journal of Clinical Oncology . 2017;35(4):440–445. doi: 10.1200/JCO.2016.69.2319. - DOI - PMC - PubMed
MeSH terms
Substances
LinkOut - more resources
Full Text Sources
Research Materials
