

Development and Validation of Nomograms to Predict Cancer-Specific Survival and Overall Survival in Elderly Patients With Prostate Cancer: A Population-Based Study
- PMID: 35814387
- PMCID: PMC9259789
- DOI: 10.3389/fonc.2022.918780
Development and Validation of Nomograms to Predict Cancer-Specific Survival and Overall Survival in Elderly Patients With Prostate Cancer: A Population-Based Study
Abstract
Objective: Prostate cancer (PC) is the most common non-cutaneous malignancy in men worldwide. Accurate predicting the survival of elderly PC patients can help reduce mortality in patients. We aimed to construct nomograms to predict cancer-specific survival (CSS) and overall survival (OS) in elderly PC patients.
Methods: Information on PC patients aged 65 years and older was downloaded from the Surveillance, Epidemiology, and End Results (SEER) database. Univariate and multivariate Cox regression models were used to determine independent risk factors for PC patients. Nomograms were developed to predict the CSS and OS of elderly PC patients based on a multivariate Cox regression model. The accuracy and discrimination of the prediction model were tested by the consistency index (C-index), the area under the subject operating characteristic curve (AUC), and the calibration curve. Decision curve analysis (DCA) was used to test the clinical value of the nomograms compared with the TNM staging system and D'Amico risk stratification system.
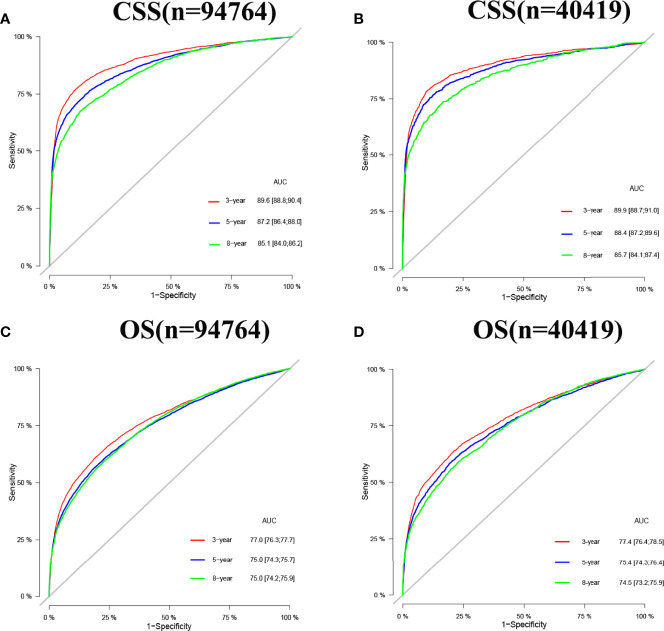
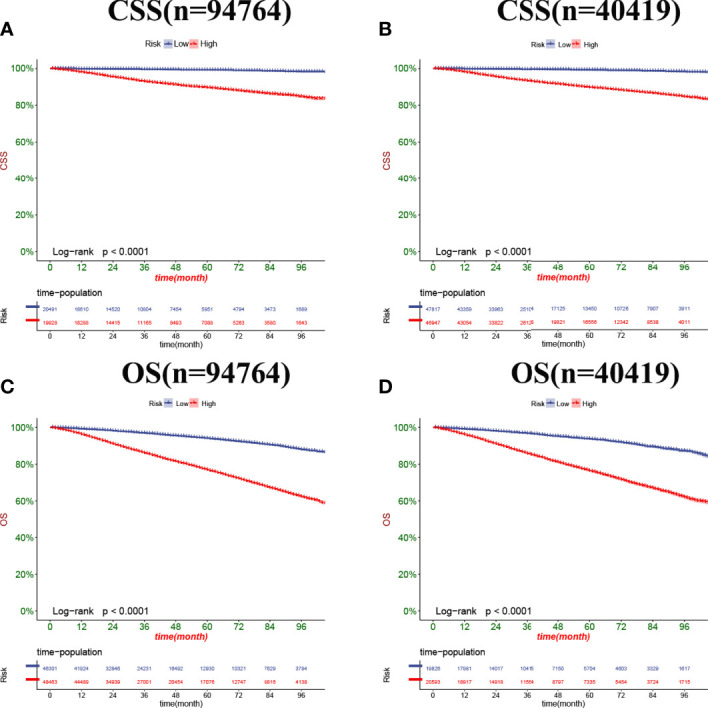
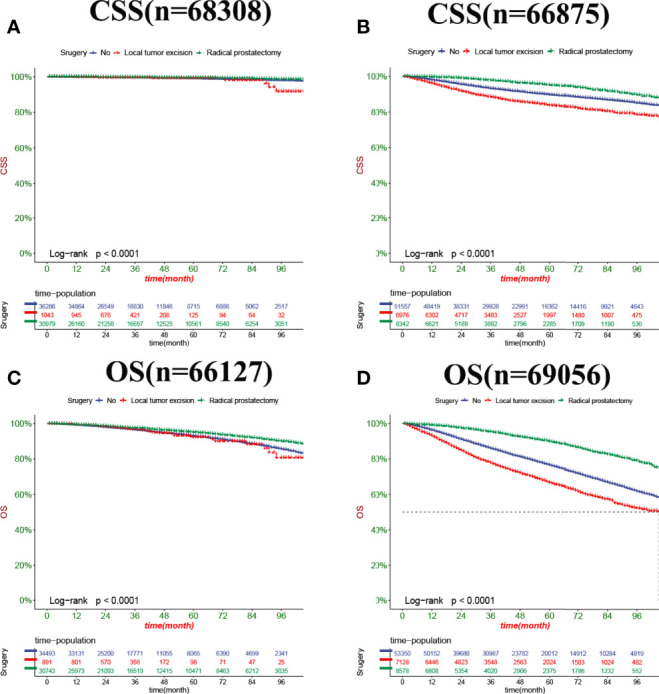
Results: 135183 elderly PC patients in 2010-2018 were included. All patients were randomly assigned to the training set (N=94764) and the validation set (N=40419). Univariate and multivariate Cox regression model analysis revealed that age, race, marriage, histological grade, TNM stage, surgery, chemotherapy, radiotherapy, biopsy Gleason score (GS), and prostate-specific antigen (PSA) were independent risk factors for predicting CSS and OS in elderly patients with PC. The C-index of the training set and the validation set for predicting CSS was 0.883(95%CI:0.877-0.889) and 0.887(95%CI:0.877-0.897), respectively. The C-index of the training set and the validation set for predicting OS was 0.77(95%CI:0.766-0.774)and 0.767(95%CI:0.759-0.775), respectively. It showed that the proposed model has excellent discriminative ability. The AUC and the calibration curves also showed good accuracy and discriminability. The DCA showed that the nomograms for CSS and OS have good clinical potential value.
Conclusions: We developed new nomograms to predict CSS and OS in elderly PC patients. The models have been internally validated with good accuracy and reliability and can help doctors and patients to make better clinical decisions.
Keywords: CSS; SEER; nomogram; old age; prostate cancer.
Copyright © 2022 Zhang, Zhanghuang, Wang, Tian, Wu, Li, Mi, Liu, Jin, Li and He.
Conflict of interest statement
The authors declare that the research was conducted in the absence of any commercial or financial relationships that could be construed as a potential conflict of interest.
Figures


Similar articles
-
Prognostic significance of surgery and radiotherapy in elderly patients with localized prostate cancer: establishing and time-based external validation a nomogram from SEER-based study.BMC Urol. 2024 Jan 6;24(1):12. doi: 10.1186/s12894-023-01384-6. BMC Urol. 2024. PMID: 38184526 Free PMC article. Clinical Trial.
-
A Web-Based Prediction Model for Cancer-Specific Survival of Elderly Patients Undergoing Surgery With Prostate Cancer: A Population-Based Study.Front Public Health. 2022 Jul 12;10:935521. doi: 10.3389/fpubh.2022.935521. eCollection 2022. Front Public Health. 2022. PMID: 35903379 Free PMC article. Clinical Trial.
-
Development and validation of a nomogram to predict cancer-specific survival in nonsurgically treated elderly patients with prostate cancer.Sci Rep. 2023 Oct 18;13(1):17719. doi: 10.1038/s41598-023-44911-z. Sci Rep. 2023. PMID: 37853026 Free PMC article. Clinical Trial.
-
Analysis of prognostic factors of metastatic endometrial cancer based on surveillance, epidemiology, and end results database.Front Surg. 2023 Jan 6;9:1001791. doi: 10.3389/fsurg.2022.1001791. eCollection 2022. Front Surg. 2023. PMID: 36684133 Free PMC article. Review.
-
Prognostic nomograms for young breast cancer: A retrospective study based on the SEER and METABRIC databases.Cancer Innov. 2024 Oct 25;3(6):e152. doi: 10.1002/cai2.152. eCollection 2024 Dec. Cancer Innov. 2024. PMID: 39464427 Free PMC article. Review.
Cited by
-
Construction and validation of web-based nomograms for detecting and prognosticating in prostate adenocarcinoma with bone metastasis.Sci Rep. 2022 Nov 3;12(1):18623. doi: 10.1038/s41598-022-23275-w. Sci Rep. 2022. PMID: 36329203 Free PMC article.
-
Multivariate logistic regression analysis of the clinical factors influencing locally advanced prostate cancer.Transl Cancer Res. 2024 Feb 29;13(2):676-685. doi: 10.21037/tcr-23-1680. Epub 2024 Feb 26. Transl Cancer Res. 2024. PMID: 38482405 Free PMC article.
-
A New Online Dynamic Nomogram: Construction and Validation of a Predictive Model for Distant Metastasis Risk and Prognosis in Patients with Gastrointestinal Stromal Tumors.J Gastrointest Surg. 2023 Jul;27(7):1429-1444. doi: 10.1007/s11605-023-05706-9. Epub 2023 May 25. J Gastrointest Surg. 2023. PMID: 37231240 Review.
-
Individualized detection of TMPRSS2-ERG fusion status in prostate cancer: a rank-based qualitative transcriptome signature.World J Surg Oncol. 2024 Feb 9;22(1):49. doi: 10.1186/s12957-024-03314-8. World J Surg Oncol. 2024. PMID: 38331878 Free PMC article.
-
Development and validation of prognostic nomograms in patients with gallbladder mucinous adenocarcinoma: A population-based study.Front Oncol. 2022 Dec 14;12:1084445. doi: 10.3389/fonc.2022.1084445. eCollection 2022. Front Oncol. 2022. PMID: 36591489 Free PMC article.
References
-
- Amin MB, Greene FL, Edge SB, Compton CC, Gershenwald JE, Brookland RK, et al. . The Eighth Edition AJCC Cancer Staging Manual: Continuing to Build a Bridge From a Population-Based to a More "Personalized" Approach to Cancer Staging. CA Cancer J Clin (2017) 67(2):93–9. doi: 10.3322/caac.21388 - DOI - PubMed
-
- Srigley JR, Delahunt B, Samaratunga H, Billis A, Cheng L, Clouston D, et al. . Controversial Issues in Gleason and International Society of Urological Pathology (ISUP) Prostate Cancer Grading: Proposed Recommendations for International Implementation. Pathology (2019) 51(5):463–73. doi: 10.1016/j.pathol.2019.05.001 - DOI - PubMed
LinkOut - more resources
Full Text Sources
Research Materials
Miscellaneous