

Deep Learning-Based Multi-Omics Integration Robustly Predicts Relapse in Prostate Cancer
- PMID: 35814412
- PMCID: PMC9259796
- DOI: 10.3389/fonc.2022.893424
Deep Learning-Based Multi-Omics Integration Robustly Predicts Relapse in Prostate Cancer
Abstract
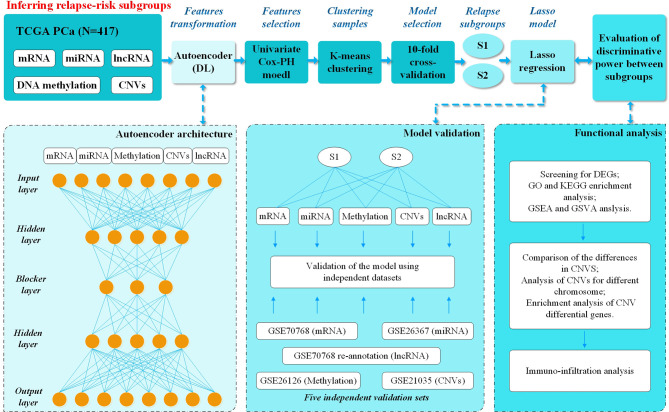
Objective: Post-operative biochemical relapse (BCR) continues to occur in a significant percentage of patients with localized prostate cancer (PCa). Current stratification methods are not adequate to identify high-risk patients. The present study exploits the ability of deep learning (DL) algorithms using the H2O package to combine multi-omics data to resolve this problem.
Methods: Five-omics data from 417 PCa patients from The Cancer Genome Atlas (TCGA) were used to construct the DL-based, relapse-sensitive model. Among them, 265 (63.5%) individuals experienced BCR. Five additional independent validation sets were applied to assess its predictive robustness. Bioinformatics analyses of two relapse-associated subgroups were then performed for identification of differentially expressed genes (DEGs), enriched pathway analysis, copy number analysis and immune cell infiltration analysis.
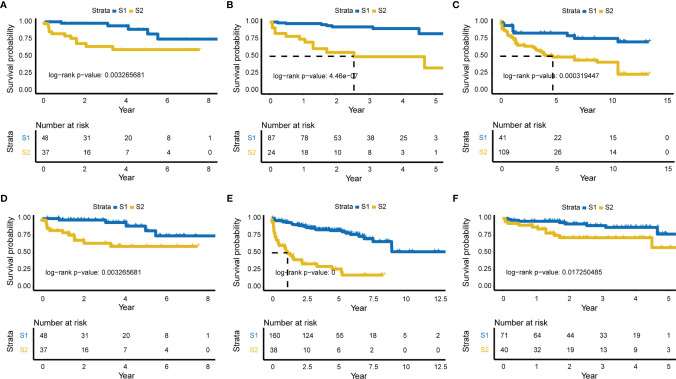
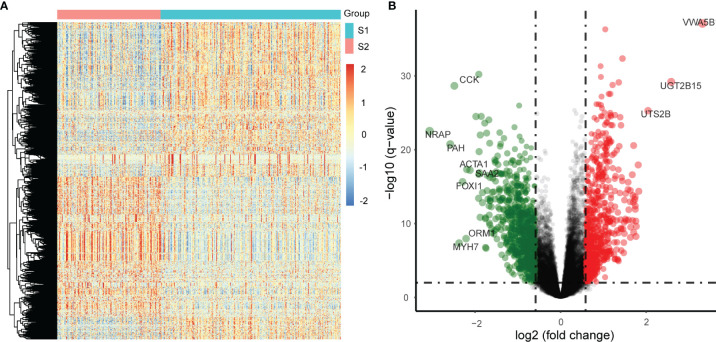
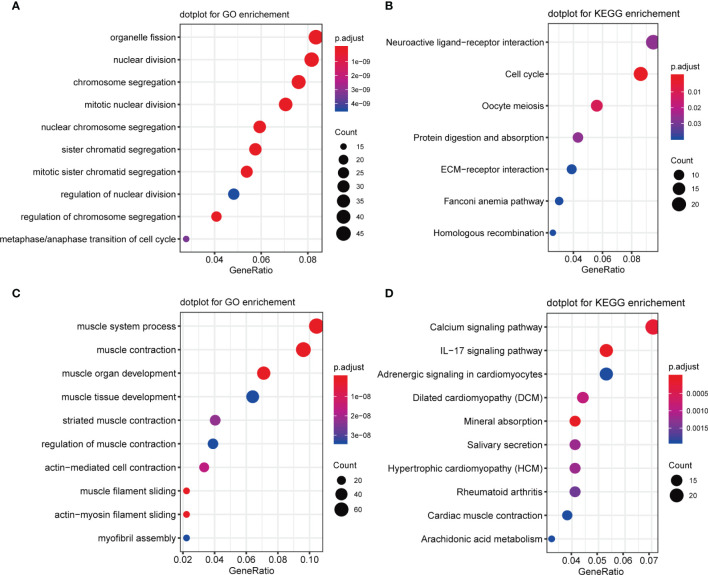
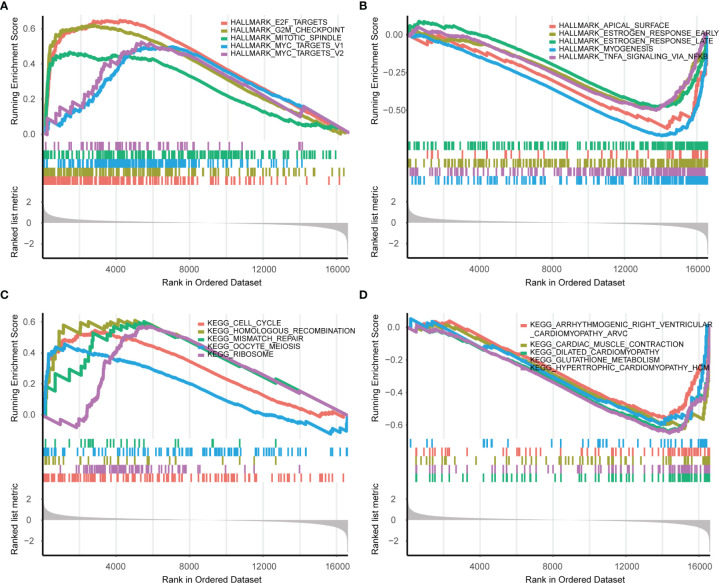
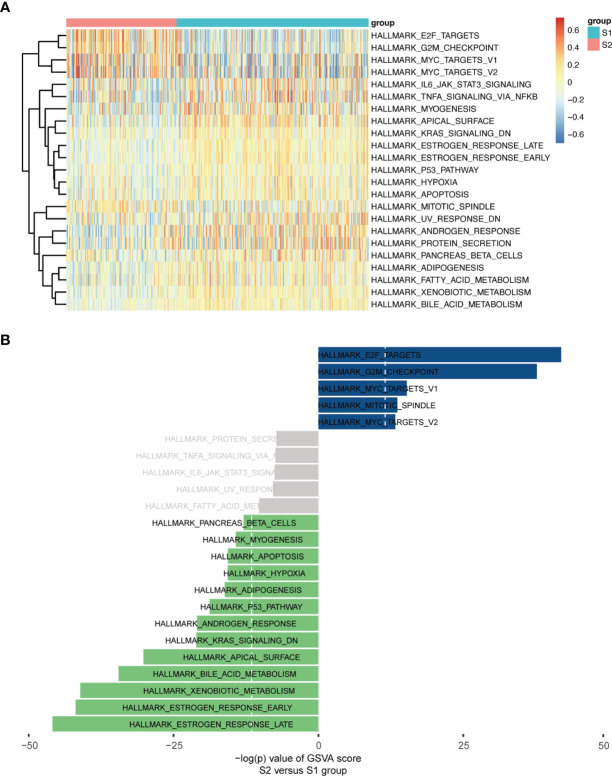
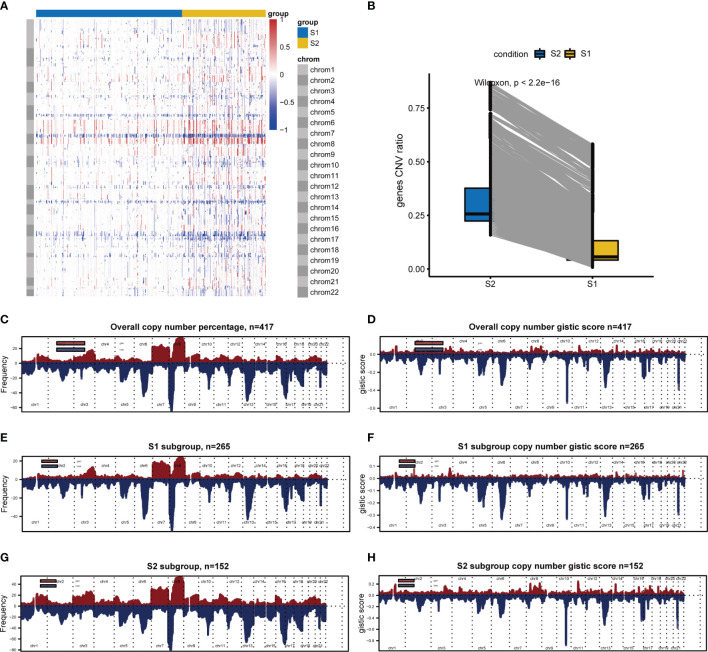
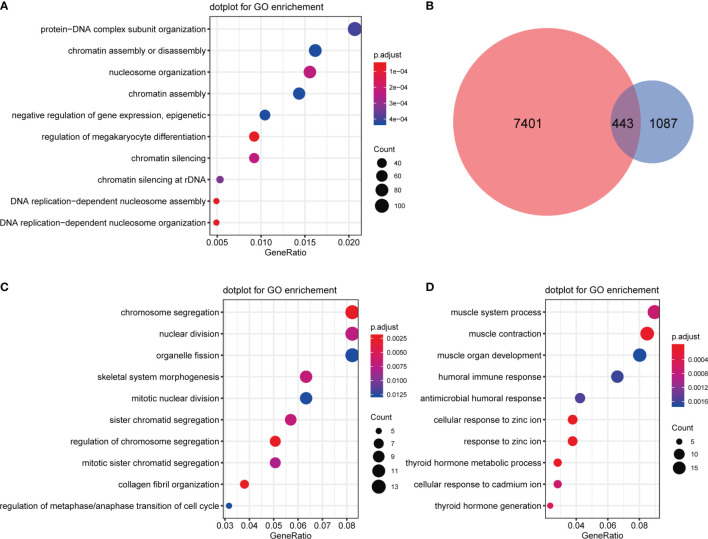
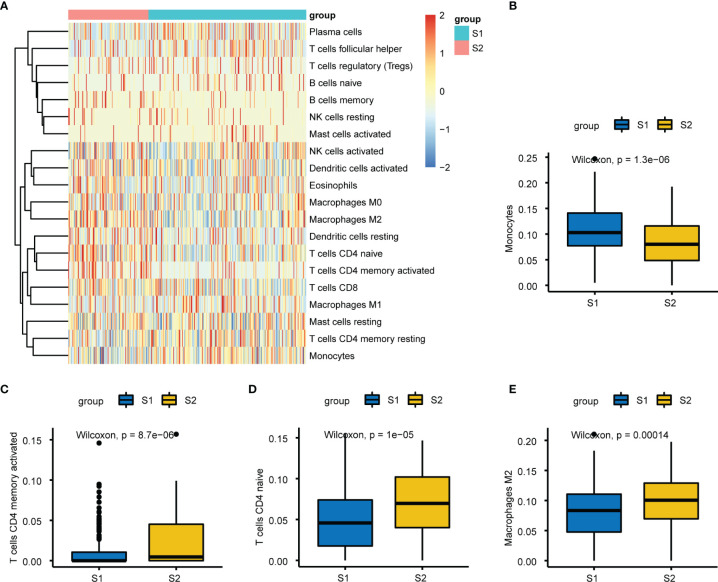
Results: The DL-based model, with a significant difference (P = 6e-9) between two subgroups and good concordance index (C-index = 0.767), were proven to be robust by external validation. 1530 DEGs including 678 up- and 852 down-regulated genes were identified in the high-risk subgroup S2 compared with the low-risk subgroup S1. Enrichment analyses found five hallmark gene sets were up-regulated while 13 were down-regulated. Then, we found that DNA damage repair pathways were significantly enriched in the S2 subgroup. CNV analysis showed that 30.18% of genes were significantly up-regulated and gene amplification on chromosomes 7 and 8 was significantly elevated in the S2 subgroup. Moreover, enrichment analysis revealed that some DEGs and pathways were associated with immunity. Three tumor-infiltrating immune cell (TIIC) groups with a higher proportion in the S2 subgroup (p = 1e-05, p = 8.7e-06, p = 0.00014) and one TIIC group with a higher proportion in the S1 subgroup (P = 1.3e-06) were identified.
Conclusion: We developed a novel, robust classification for understanding PCa relapse. This study validated the effectiveness of deep learning technique in prognosis prediction, and the method may benefit patients and prevent relapse by improving early detection and advancing early intervention.
Keywords: H2O package; autoencoder; deep learning; multi-omics; prostate cancer; relapse prediction.
Copyright © 2022 Wei, Han, Zhang, Wang, Liu, Chao, Song and Chen.
Conflict of interest statement
The authors declare that the research was conducted in the absence of any commercial or financial relationships that could be construed as a potential conflict of interest.
Figures
Similar articles
-
Survival prediction in patients with colon adenocarcinoma via multi-omics data integration using a deep learning algorithm.Biosci Rep. 2020 Dec 1;40(12):BSR20201482. doi: 10.1042/BSR20201482. Online ahead of print. Biosci Rep. 2020. PMID: 33258470 Free PMC article.
-
Deep Learning-Based Multi-Omics Integration Robustly Predicts Survival in Liver Cancer.Clin Cancer Res. 2018 Mar 15;24(6):1248-1259. doi: 10.1158/1078-0432.CCR-17-0853. Epub 2017 Oct 5. Clin Cancer Res. 2018. PMID: 28982688 Free PMC article.
-
Deep learning-based model for predicting progression in patients with head and neck squamous cell carcinoma.Cancer Biomark. 2020;27(1):19-28. doi: 10.3233/CBM-190380. Cancer Biomark. 2020. PMID: 31658045
-
Robust Prognostic Subtyping of Muscle-Invasive Bladder Cancer Revealed by Deep Learning-Based Multi-Omics Data Integration.Front Oncol. 2021 Aug 6;11:689626. doi: 10.3389/fonc.2021.689626. eCollection 2021. Front Oncol. 2021. PMID: 34422643 Free PMC article.
-
Survival stratification for colorectal cancer via multi-omics integration using an autoencoder-based model.Exp Biol Med (Maywood). 2022 Jun;247(11):898-909. doi: 10.1177/15353702211065010. Epub 2021 Dec 14. Exp Biol Med (Maywood). 2022. PMID: 34904882 Free PMC article.
Cited by
-
Deep learning-driven multi-omics analysis: enhancing cancer diagnostics and therapeutics.Brief Bioinform. 2025 Jul 2;26(4):bbaf440. doi: 10.1093/bib/bbaf440. Brief Bioinform. 2025. PMID: 40874818 Free PMC article. Review.
-
Deep Learning Techniques with Genomic Data in Cancer Prognosis: A Comprehensive Review of the 2021-2023 Literature.Biology (Basel). 2023 Jun 21;12(7):893. doi: 10.3390/biology12070893. Biology (Basel). 2023. PMID: 37508326 Free PMC article.
-
Prostate cancer bioinformatics analysis: emerging genomic profiling techniques.Transl Cancer Res. 2023 Jan 30;12(1):4-7. doi: 10.21037/tcr-22-2423. Epub 2023 Jan 5. Transl Cancer Res. 2023. PMID: 36760375 Free PMC article. No abstract available.
-
Role of multi‑omics in advancing the understanding and treatment of prostate cancer (Review).Mol Med Rep. 2025 May;31(5):130. doi: 10.3892/mmr.2025.13495. Epub 2025 Mar 21. Mol Med Rep. 2025. PMID: 40116118 Free PMC article. Review.
-
Advancing precision oncology with AI-powered genomic analysis.Front Pharmacol. 2025 Apr 30;16:1591696. doi: 10.3389/fphar.2025.1591696. eCollection 2025. Front Pharmacol. 2025. PMID: 40371349 Free PMC article. Review.
References
LinkOut - more resources
Full Text Sources