

Molecular Characterization and Clinical Relevance of N6-Methyladenosine Regulators in Metastatic Prostate Cancer
- PMID: 35814454
- PMCID: PMC9257042
- DOI: 10.3389/fonc.2022.914692
Molecular Characterization and Clinical Relevance of N6-Methyladenosine Regulators in Metastatic Prostate Cancer
Abstract
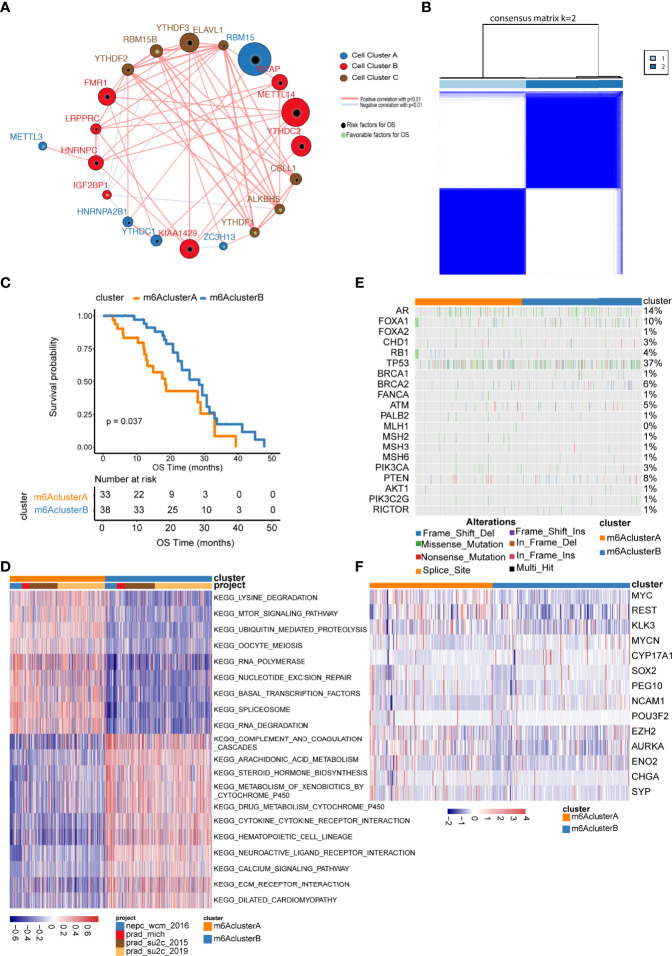
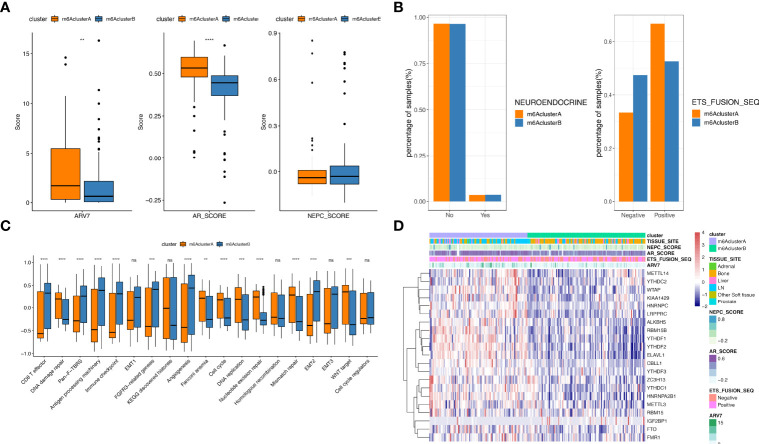
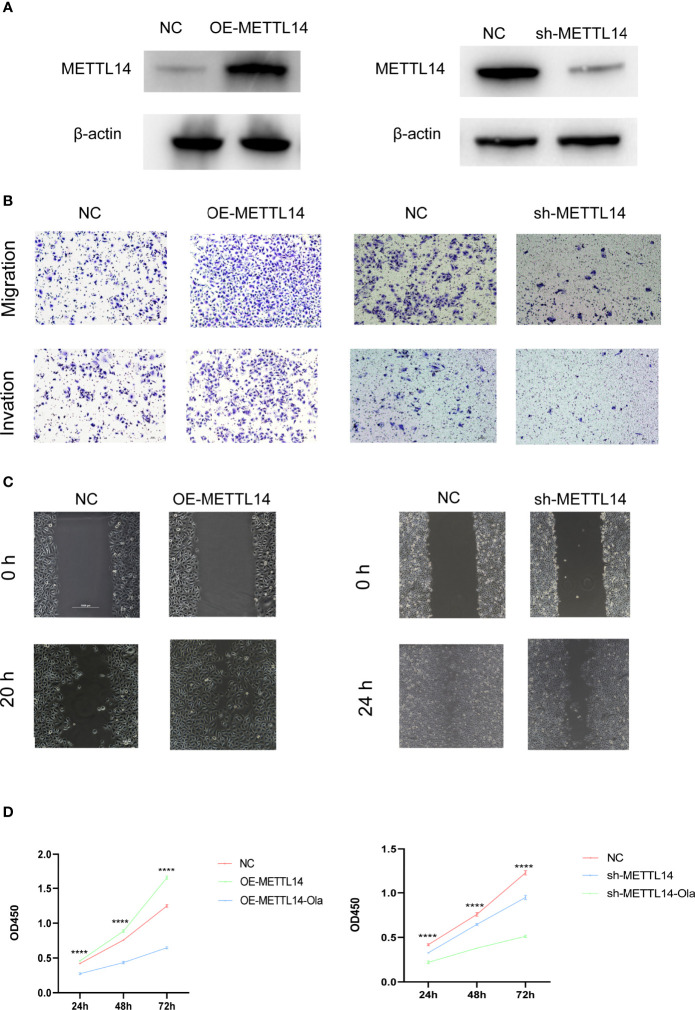
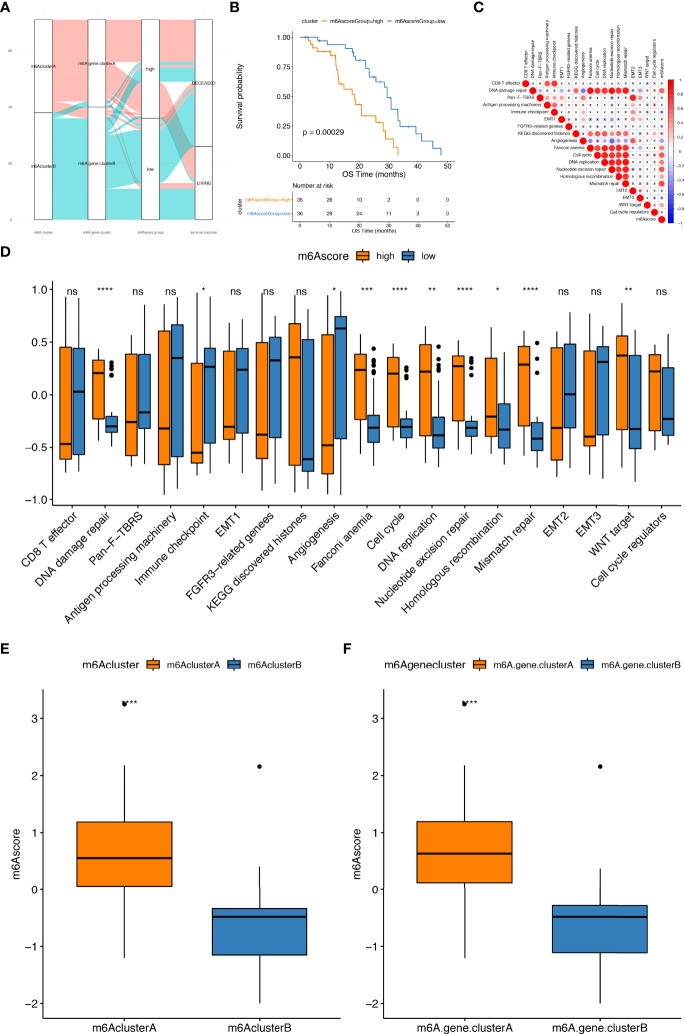
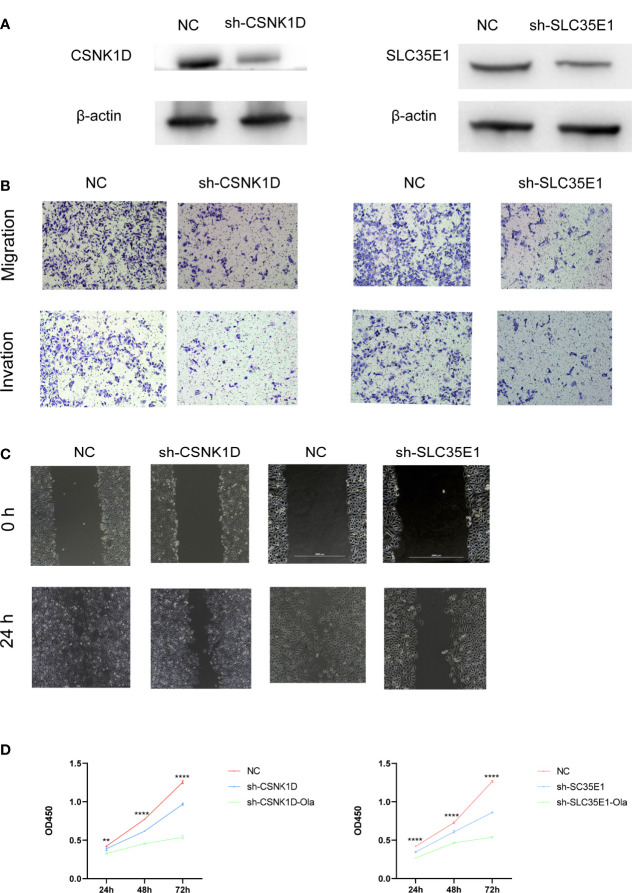
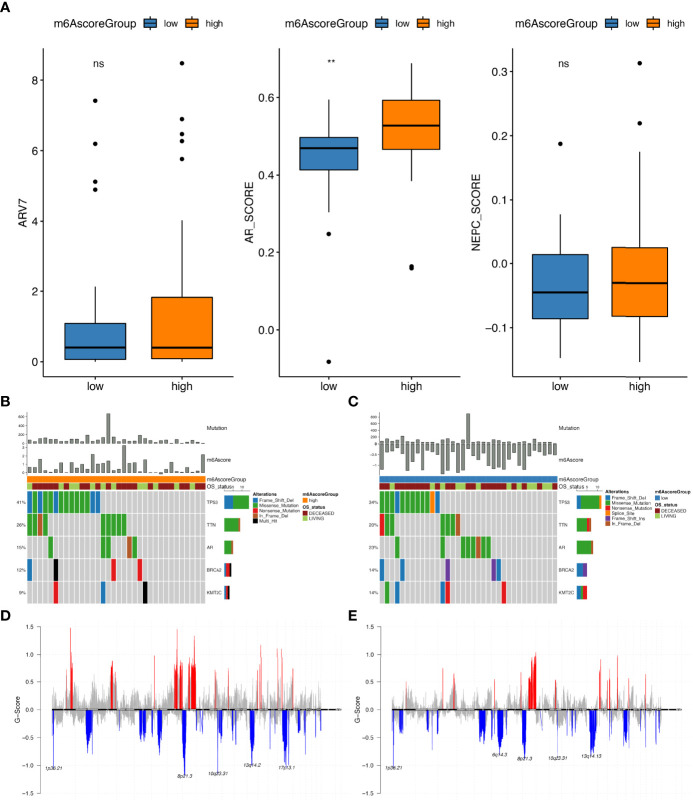
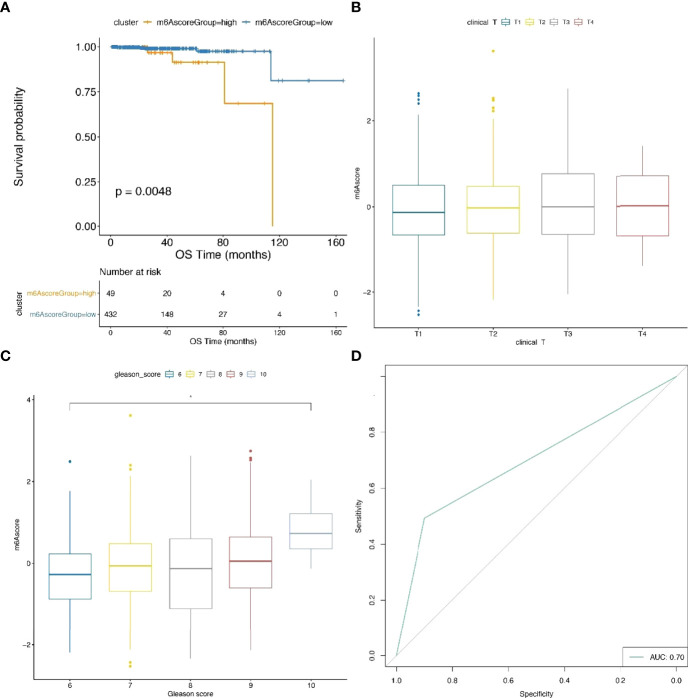
Prostate cancer is a leading malignancy in the male population globally. N6-methylation of adenosine (m6A) is the most prevalent mRNA modification and plays an essential role in various biological processes in vivo. However, the potential roles of m6A in metastatic prostate cancer are largely unknown. In this study, we evaluated and identified two m6A modification patterns based on 21 m6A regulators in four public metastatic prostate cancer datasets. Different modification patterns correlated with distinct molecular characteristics. According to m6A-associated genes, we constructed a prognostic model, called m6Ascore, to predict the outcomes of patients with metastatic prostate cancer. We found that high m6A score level was related to dismal prognosis and characterized by higher cell cycle, DNA repair and mismatch repair pathway score. In vitro experiments confirmed that upregulation of METTL14, an m6A writer, enhanced the invasion, metastasis, and sensitivity of prostate cancer cells to poly (ADP-ribose) polymerase inhibitor. Conversely, down-regulation of potential target genes of m6A had the opposite effect. Finally, we validated that a higher m6A score was associated with a worse prognosis and a higher Gleason score in The Cancer Genome Atlas Program (TCGA) cohort. This work illustrated the nonnegligible role of m6A modification in multiple biological processes of metastatic prostate cancer. Evaluating the m6A risk scores of individual tumours will guide more effective judgement of prognosis as well as treatments for metastatic prostate cancer in clinical practice.
Keywords: m6A; metastatic prostate cancer; prognosis; regulator; treatment.
Copyright © 2022 Liu, Li, He, Li, Hu, Chen, Zhou, Wang, Li and Xiao.
Conflict of interest statement
The authors declare that the research was conducted in the absence of any commercial or financial relationships that could be construed as a potential conflict of interest.
Figures
Similar articles
-
Construction of a risk prediction model using m6A RNA methylation regulators in prostate cancer: comprehensive bioinformatic analysis and histological validation.Cancer Cell Int. 2022 Jan 19;22(1):33. doi: 10.1186/s12935-021-02438-1. Cancer Cell Int. 2022. PMID: 35045837 Free PMC article.
-
The significance of m6A RNA methylation modification in prognosis and tumor microenvironment immune infiltration of cervical cancer.Medicine (Baltimore). 2022 Jul 1;101(26):e29818. doi: 10.1097/MD.0000000000029818. Medicine (Baltimore). 2022. PMID: 35777046 Free PMC article.
-
RNA m6A Methylation Regulators Multi-Omics Analysis in Prostate Cancer.Front Genet. 2021 Nov 26;12:768041. doi: 10.3389/fgene.2021.768041. eCollection 2021. Front Genet. 2021. PMID: 34899855 Free PMC article.
-
Thyroid cancer risk prediction model using m6A RNA methylation regulators: integrated bioinformatics analysis and histological validation.Aging (Albany NY). 2023 Feb 15;15(3):846-865. doi: 10.18632/aging.204525. Epub 2023 Feb 15. Aging (Albany NY). 2023. PMID: 36791151 Free PMC article.
-
Contributions and Prognostic Values of N6-Methyladenosine RNA Methylation Regulators in Hepatocellular Carcinoma.Front Genet. 2021 Jan 15;11:614566. doi: 10.3389/fgene.2020.614566. eCollection 2020. Front Genet. 2021. PMID: 33519919 Free PMC article.
Cited by
-
RNA N6-methyladenosine modifications in urological cancers: from mechanism to application.Nat Rev Urol. 2024 Aug;21(8):460-476. doi: 10.1038/s41585-023-00851-x. Epub 2024 Feb 12. Nat Rev Urol. 2024. PMID: 38347160 Review.
-
The m6A methylation landscape, molecular characterization and clinical relevance in prostate adenocarcinoma.Front Immunol. 2023 Mar 23;14:1086907. doi: 10.3389/fimmu.2023.1086907. eCollection 2023. Front Immunol. 2023. PMID: 37033963 Free PMC article.
-
The current landscape of m6A modification in urological cancers.PeerJ. 2023 Sep 7;11:e16023. doi: 10.7717/peerj.16023. eCollection 2023. PeerJ. 2023. PMID: 37701836 Free PMC article. Review.
-
RNA m6a Methylation Regulator Expression in Castration-Resistant Prostate Cancer Progression and Its Genetic Associations.Cancers (Basel). 2024 Mar 27;16(7):1303. doi: 10.3390/cancers16071303. Cancers (Basel). 2024. PMID: 38610981 Free PMC article.
-
Clinical and molecular significance of the RNA m6A methyltransferase complex in prostate cancer.Front Genet. 2023 Jan 12;13:1096071. doi: 10.3389/fgene.2022.1096071. eCollection 2022. Front Genet. 2023. PMID: 36733939 Free PMC article.
References
LinkOut - more resources
Full Text Sources