Peritumoral Imaging Manifestations on Gd-EOB-DTPA-Enhanced MRI for Preoperative Prediction of Microvascular Invasion in Hepatocellular Carcinoma: A Systematic Review and Meta-Analysis
- PMID: 35814461
- PMCID: PMC9263828
- DOI: 10.3389/fonc.2022.907076
Peritumoral Imaging Manifestations on Gd-EOB-DTPA-Enhanced MRI for Preoperative Prediction of Microvascular Invasion in Hepatocellular Carcinoma: A Systematic Review and Meta-Analysis
Abstract
Purpose: The aim was to investigate the association between microvascular invasion (MVI) and the peritumoral imaging features of gadolinium ethoxybenzyl DTPA-enhanced magnetic resonance imaging (Gd-EOB-DTPA-enhanced MRI) in hepatocellular carcinoma (HCC).
Methods: Up until Feb 24, 2022, the PubMed, Embase, and Cochrane Library databases were carefully searched for relevant material. The software packages utilized for this meta-analysis were Review Manager 5.4.1, Meta-DiSc 1.4, and Stata16.0. Summary results are presented as sensitivity (SEN), specificity (SPE), diagnostic odds ratios (DORs), area under the receiver operating characteristic curve (AUC), and 95% confidence interval (CI). The sources of heterogeneity were investigated using subgroup analysis.
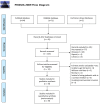
Results: An aggregate of nineteen articles were remembered for this meta-analysis: peritumoral enhancement on the arterial phase (AP) was described in 13 of these studies and peritumoral hypointensity on the hepatobiliary phase (HBP) in all 19 studies. The SEN, SPE, DOR, and AUC of the 13 investigations on peritumoral enhancement on AP were 0.59 (95% CI, 0.41-0.58), 0.80 (95% CI, 0.75-0.85), 4 (95% CI, 3-6), and 0.73 (95% CI, 0.69-0.77), respectively. The SEN, SPE, DOR, and AUC of 19 studies on peritumoral hypointensity on HBP were 0.55 (95% CI, 0.45-0.64), 0.87 (95% CI, 0.81-0.91), 8 (95% CI, 5-12), and 0.80 (95% CI, 0.76-0.83), respectively. The subgroup analysis of two imaging features identified ten and seven potential factors for heterogeneity, respectively.
Conclusion: The results of peritumoral enhancement on the AP and peritumoral hypointensity on HBP showed high SPE but low SEN. This indicates that the peritumoral imaging features on Gd-EOB-DTPA-enhanced MRI can be used as a noninvasive, excluded diagnosis for predicting hepatic MVI in HCC preoperatively. Moreover, the results of this analysis should be updated when additional data become available. Additionally, in the future, how to improve its SEN will be a new research direction.
Keywords: Gd-EOB-DTPA-enhanced MRI; hepatocellular carcinoma; meta-analysis; microvascular invasion; peritumoral enhancement; peritumoral hypointensity.
Copyright © 2022 Wu, Zhu, Liu, Cao, Zhang and Yin.
Conflict of interest statement
The authors declare that the research was conducted in the absence of any commercial or financial relationships that could be construed as a potential conflict of interest.
Figures


Similar articles
-
Is Gadoxetic Acid Disodium (Gd-EOB-DTPA)-Enhanced Magnetic Resonance Imaging an Accurate Diagnostic Method for Hepatocellular Carcinoma? A Systematic Review with Meta-Analysis.Curr Med Imaging. 2022;18(6):633-647. doi: 10.2174/1573405617666210917124404. Curr Med Imaging. 2022. PMID: 34533447
-
The value of the signal intensity of peritumoral tissue on Gd-EOB-DTPA dynamic enhanced MRI in assessment of microvascular invasion and pathological grade of hepatocellular carcinoma.Medicine (Baltimore). 2021 May 21;100(20):e25804. doi: 10.1097/MD.0000000000025804. Medicine (Baltimore). 2021. PMID: 34011043 Free PMC article.
-
VICT2 Trait: Prognostic Alternative to Peritumoral Hepatobiliary Phase Hypointensity in HCC.Radiology. 2023 Apr;307(2):e221835. doi: 10.1148/radiol.221835. Epub 2023 Feb 14. Radiology. 2023. PMID: 36786702
-
Performance of adding hepatobiliary phase image in magnetic resonance imaging for detection of hepatocellular carcinoma: a meta-analysis.Eur Radiol. 2022 Nov;32(11):7883-7895. doi: 10.1007/s00330-022-08826-z. Epub 2022 May 17. Eur Radiol. 2022. PMID: 35579711
-
Peritumoral tissue on preoperative imaging reveals microvascular invasion in hepatocellular carcinoma: a systematic review and meta-analysis.Abdom Radiol (NY). 2018 Dec;43(12):3324-3330. doi: 10.1007/s00261-018-1646-5. Abdom Radiol (NY). 2018. PMID: 29845312
Cited by
-
MRI Features for Predicting Microvascular Invasion and Postoperative Recurrence in Hepatocellular Carcinoma Without Peritumoral Hypointensity.J Hepatocell Carcinoma. 2023 Sep 25;10:1595-1608. doi: 10.2147/JHC.S422632. eCollection 2023. J Hepatocell Carcinoma. 2023. PMID: 37786565 Free PMC article.
-
Chinese expert consensus on the diagnosis and treatment of hepatocellular carcinoma with microvascular invasion (2024 edition).Hepatobiliary Surg Nutr. 2025 Apr 1;14(2):246-266. doi: 10.21037/hbsn-24-359. Epub 2024 Dec 30. Hepatobiliary Surg Nutr. 2025. PMID: 40342785 Free PMC article. Review.
-
Non-invasive prediction of microvascular invasion in patients with hepatocellular carcinoma: is there any added value in combining imaging features and radiomics?Eur Radiol. 2023 Sep;33(9):6459-6461. doi: 10.1007/s00330-023-09792-w. Epub 2023 Jun 30. Eur Radiol. 2023. PMID: 37391622 No abstract available.
-
Evaluating the Efficacy and Accuracy of AI-Assisted Diagnostic Techniques in Endometrial Carcinoma: A Systematic Review.Cureus. 2024 May 24;16(5):e60973. doi: 10.7759/cureus.60973. eCollection 2024 May. Cureus. 2024. PMID: 38910646 Free PMC article. Review.
-
Intranodular and perinodular ultrasound radiomics distinguishes benign and malignant thyroid nodules: a multicenter study.Gland Surg. 2024 Dec 31;13(12):2359-2371. doi: 10.21037/gs-24-416. Epub 2024 Dec 27. Gland Surg. 2024. PMID: 39822358 Free PMC article.
References
-
- Lim KC, Chow PK, Allen JC, Chia GS, Lim M, Cheow PC, et al. . Microvascular Invasion is a Better Predictor of Tumor Recurrence and Overall Survival Following Surgical Resection for Hepatocellular Carcinoma Compared to the Milan Criteria. Ann Surg (2011) 254(1):108–13. doi: 10.1097/SLA.0b013e31821ad884 - DOI - PubMed
Publication types
LinkOut - more resources
Full Text Sources
Miscellaneous

