

Demonstration of Gut-Barrier Dysfunction in Early Stages of Non-alcoholic Fatty Liver Disease: A Proof-Of-Concept Study
- PMID: 35814507
- PMCID: PMC9257921
- DOI: 10.1016/j.jceh.2022.01.006
Demonstration of Gut-Barrier Dysfunction in Early Stages of Non-alcoholic Fatty Liver Disease: A Proof-Of-Concept Study
Abstract
Background/aims: Gut-barrier dysfunction is well recognized in pathogenesis of both non-alcoholic fatty liver disease (NAFLD) and alcoholic liver disease (ALD). However, comparison of components of this dysfunction between the two etiologies remains unexplored especially in early stages of NAFLD.
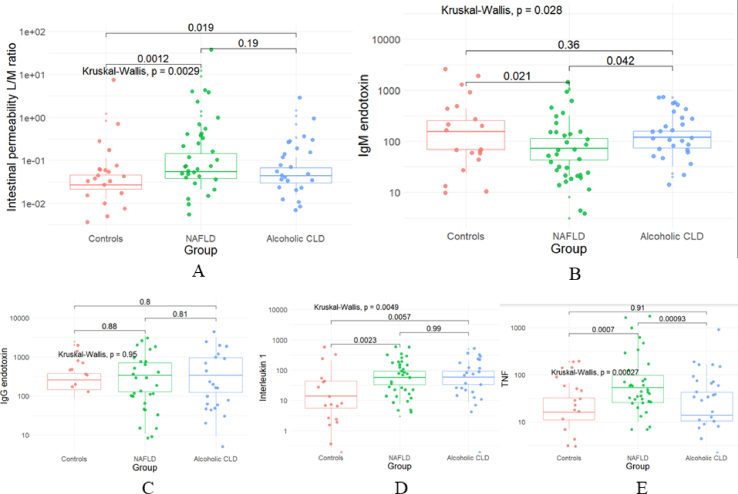
Methods: Components of gut-barrier dysfunction like alterations in intestinal permeability (IP) by lactulose mannitol ratio (LMR) in urine, systemic endotoxemia (IgG and IgM anti-endotoxin antibodies), systemic inflammation (serum tumor necrosis factor alpha [TNF-α] and interleukin-1 [IL-1] levels), tight junction (TJ) proteins expression in duodenal biopsy and stool microbiota composition using Oxford Nanopore MinION device were prospectively evaluated in patients with NAFLD (n = 34) with no cirrhosis, ALD (n = 28) and were compared with disease free controls (n = 20).
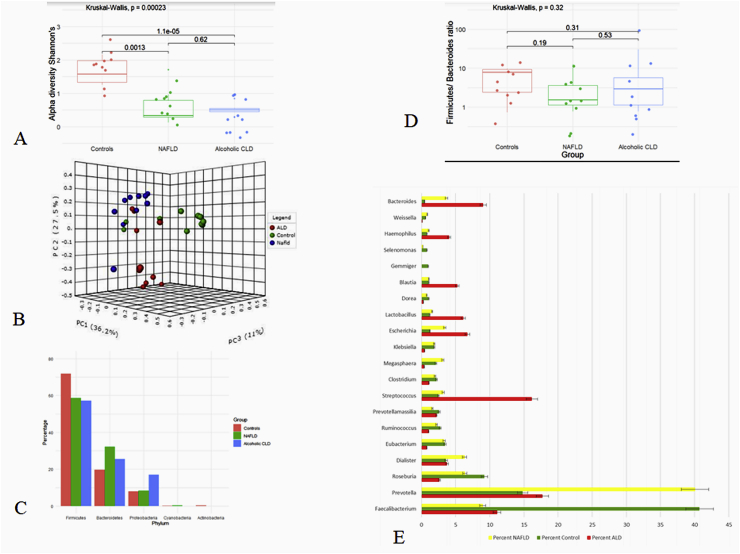
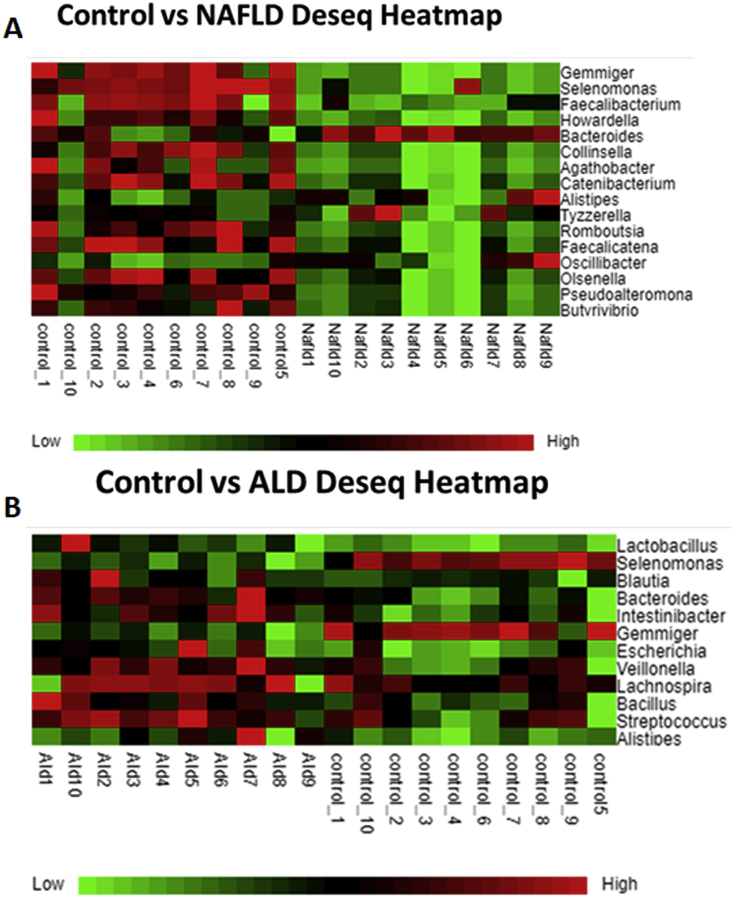
Results: Patients with ALD had more advanced disease than those with NAFLD (median liver stiffness -NAFLD:7.1 kPa [5.9-8.9] vs. ALD:14.3 kPa [9.6-24], P < 0.001]. Median LMR was significantly higher in NAFLD and ALD group when compared to controls (NAFLD 0.054 [0.037-0.17] vs. controls 0.027 [0.021-0.045] (P = 0.001)) and ALD 0.043 [0.03-0.068] vs. controls 0.027 [0.021-0.045] (P = 0.019)]. Anti-endotoxin antibody titer (IgM) (MMU/mL) was lowest in NAFLD 72.9 [3.2-1089.5] compared to ALD 120.6 [20.1-728]) (P = 0.042) and controls 155.3 [23.8-442.9]) (P = 0.021). Median TNF-α (pg/mL) levels were elevated in patients with NAFLD (53.3 [24.5-115]) compared to controls (16.1 [10.8-33.3]) (P < 0.001) and ALD (12.3 [10.1-42.7]) (P < 0.001). Expression of zonulin-1 and claudin-3 in duodenal mucosa was lowest in NAFLD. On principal co-ordinate analysis (PCoA), the global bacterial composition was significantly different across the three groups (PERMANOVA test, P < 0.001).
Conclusion: While remaining activated in both etiologies, gut-barrier dysfunction abnormalities were more pronounced in NAFLD at early stages compared to ALD despite more advanced disease in the latter.
Keywords: ALD, alcoholic liver disease; ALT, alanine transaminase; AST, aspartate transaminase; IL-1, interleukin-1; IP, intestinal permeability; KFT, kidney function test; LFT, liver function test; LMR, lactulose mannitol ratio; NAFLD, non-alcoholic fatty liver disease; TNF, tumor necrosis factor; alcoholic liver disease; endotoxemia; intestinal permeability; non-alcoholic fatty liver disease; tight junction protein.
© 2022 Indian National Association for Study of the Liver. Published by Elsevier B.V.
Figures
Similar articles
-
[Changes in the intestinal microenvironment during development of alcoholic fatty liver disease and related effects of probiotic therapy].Zhonghua Gan Zang Bing Za Zhi. 2012 Nov;20(11):848-52. doi: 10.3760/cma.j.issn.1007-3418.2012.11.010. Zhonghua Gan Zang Bing Za Zhi. 2012. PMID: 23206305 Chinese.
-
Non-invasive separation of alcoholic and non-alcoholic liver disease with predictive modeling.PLoS One. 2014 Jul 2;9(7):e101444. doi: 10.1371/journal.pone.0101444. eCollection 2014. PLoS One. 2014. PMID: 24988316 Free PMC article.
-
Diagnostic value of alcoholic liver disease (ALD)/nonalcoholic fatty liver disease (NAFLD) index combined with γ-glutamyl transferase in differentiating ALD and NAFLD.Korean J Intern Med. 2016 May;31(3):479-87. doi: 10.3904/kjim.2015.253. Epub 2016 Mar 30. Korean J Intern Med. 2016. PMID: 27025268 Free PMC article.
-
n-3 Polyunsaturated fatty acids for the management of alcoholic liver disease: A critical review.Crit Rev Food Sci Nutr. 2019;59(sup1):S116-S129. doi: 10.1080/10408398.2018.1544542. Epub 2018 Dec 22. Crit Rev Food Sci Nutr. 2019. PMID: 30580553 Review.
-
Gut Microbiota and Alcoholic Liver Disease.Rev Recent Clin Trials. 2016;11(3):213-9. doi: 10.2174/1574887111666160810100538. Rev Recent Clin Trials. 2016. PMID: 27515958 Review.
Cited by
-
Nonalcoholic Fatty Liver Disease and Its Complex Relation with Type 2 Diabetes Mellitus-From Prevalence to Diagnostic Approach and Treatment Strategies.J Clin Med. 2022 Aug 31;11(17):5144. doi: 10.3390/jcm11175144. J Clin Med. 2022. PMID: 36079070 Free PMC article. Review.
-
Betaine regulates the gut-liver axis: a therapeutic approach for chronic liver diseases.Front Nutr. 2025 Mar 24;12:1478542. doi: 10.3389/fnut.2025.1478542. eCollection 2025. Front Nutr. 2025. PMID: 40196019 Free PMC article. Review.
-
Role of gut microbiota and immune cells in metabolic-associated fatty liver disease: clinical impact.Hepatol Int. 2024 Oct;18(Suppl 2):861-872. doi: 10.1007/s12072-024-10674-6. Epub 2024 Jul 12. Hepatol Int. 2024. PMID: 38995341 Review.
-
TNFα is a key trigger of inflammation in diet-induced non-obese MASLD in mice.Redox Biol. 2023 Oct;66:102870. doi: 10.1016/j.redox.2023.102870. Epub 2023 Sep 1. Redox Biol. 2023. PMID: 37683301 Free PMC article.
-
Paracellular permeability and tight junction regulation in gut health and disease.Nat Rev Gastroenterol Hepatol. 2023 Jul;20(7):417-432. doi: 10.1038/s41575-023-00766-3. Epub 2023 Apr 25. Nat Rev Gastroenterol Hepatol. 2023. PMID: 37186118 Free PMC article. Review.
References
LinkOut - more resources
Full Text Sources
