

Quantitative Ultrasound Assessment of Hepatic Steatosis
- PMID: 35814521
- PMCID: PMC9257875
- DOI: 10.1016/j.jceh.2022.01.007
Quantitative Ultrasound Assessment of Hepatic Steatosis
Abstract
Background/aims: Non-alcoholic fatty liver disease (NAFLD) is widespread chronic disease of the live in humans with the prevalence of 30% of the United States population.1,2 The goal of the study is to validate the performance of quantitative ultrasound algorithms in the assessment of hepatic steatosis in patients with suspected NAFLD.
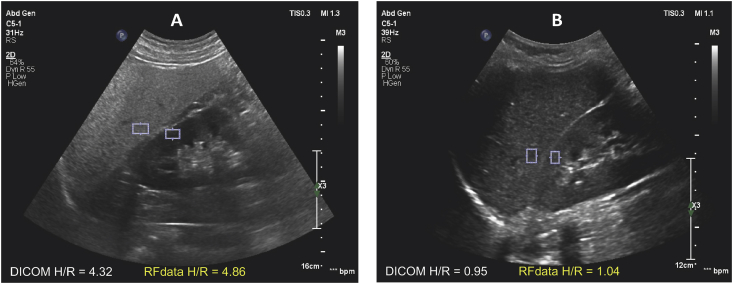
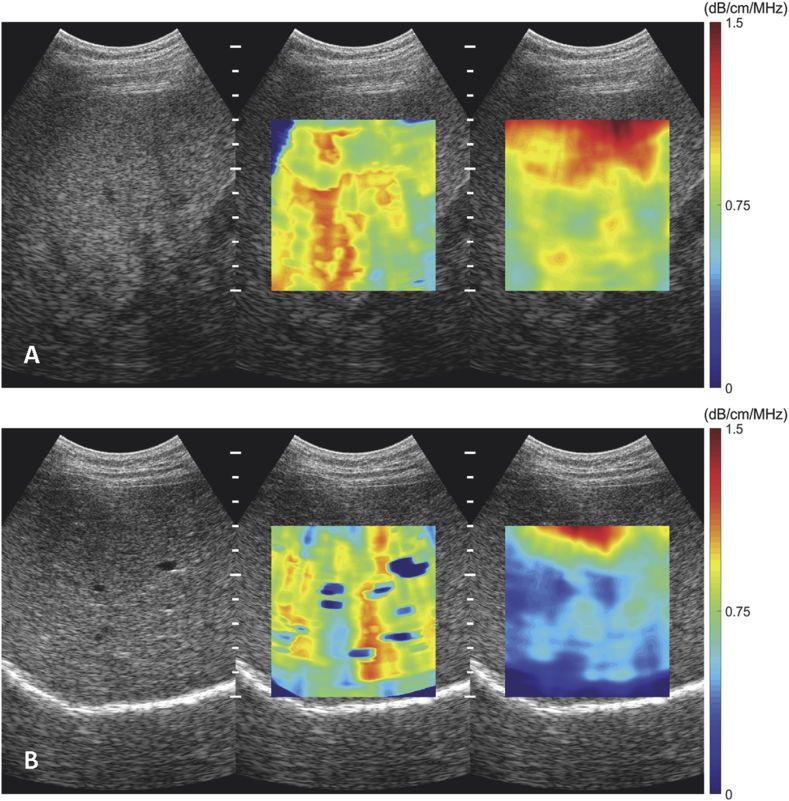
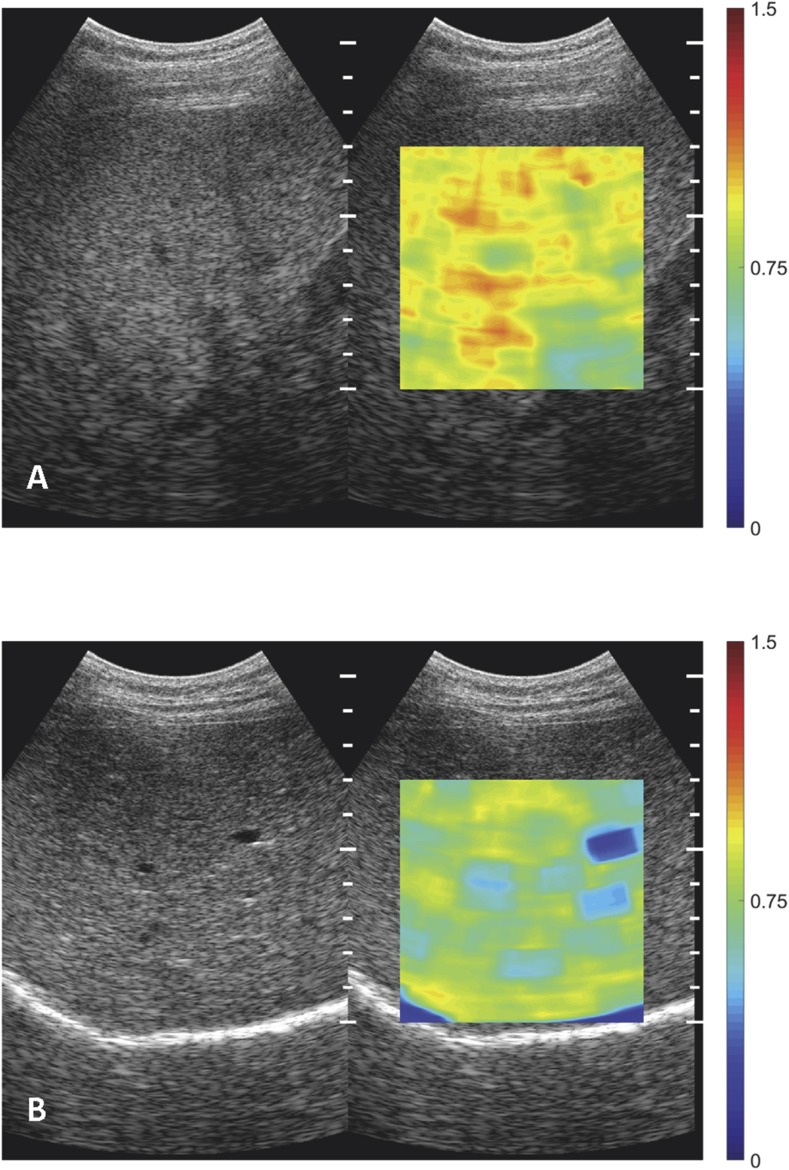
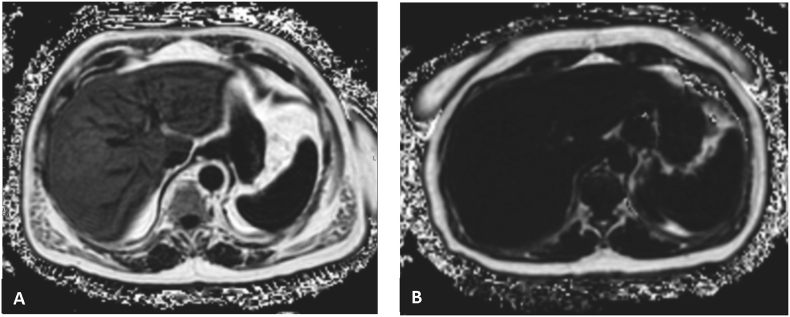
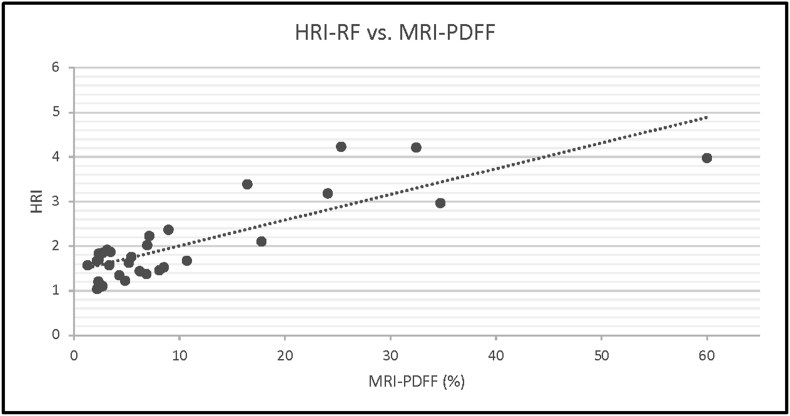
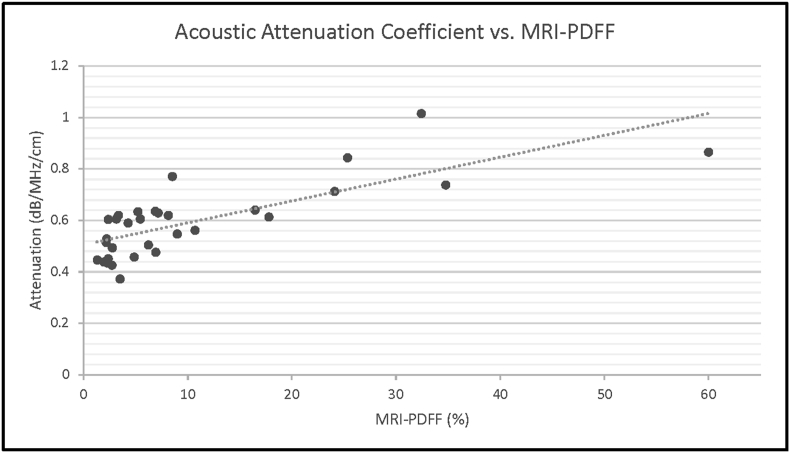
Methods: This prospective study enrolled a total of 31 patients with clinical suspicion of NAFLD to receive liver fat measurements by quantitative ultrasound and reference MRI measurements (proton density fat-fraction, PDFF). The following ultrasound (US) parameters based on both raw ultrasound RF (Radio Frequency) data and 2D B-mode images of the liver were analyzed with subsequent correlation with MRI-PDFF: hepatorenal index, acoustic attenuation coefficient, Nakagami coefficient parameter, shear wave viscosity, shear wave dispersion and shear wave elasticity. Ultrasound parameters were also correlated with the presence of hypertension and diabetes.
Results: The mean (± SD) age and body mass index of the patients were 49.03 (± 12.49) and 30.12 (± 6.15), respectively. Of the aforementioned ultrasound parameters, the hepatorenal index and acoustic attenuation coefficient showed a strong correlation with MRI-PDFF derivations of hepatic steatosis, with r-values of 0.829 and 0.765, respectively. None of the remaining US parameters showed strong correlations with PDFF. Significant differences in Nakagami parameters and acoustic attenuation coefficients were found in those patients with and without hypertension.
Conclusions: Hepatorenal index and acoustic attenuation coefficient correlate well with MRI-PDFF-derived measurements of hepatic steatosis. Quantitative ultrasound is a promising tool for the diagnosis and assessment of patients with NAFLD.
Keywords: ALT, alanine aminotransferase; AST, aspartate aminotransferase; BMI, body mass index; DICOM, digital imaging and communications in medicine; HIPAA, health insurance portability and accountability act; HRI, hepatorenal index; Hgb A1C, hemoglobin A1C (glycated hemoglobin); IQ, in-phase quadrature; IR, insulin resistance; LDL, low-density lipoprotein; MRI-PDFF, magnetic resonance imaging - proton density fat-fraction; NAFLD, non-alcoholic fatty liver disease; NASH, non-alcoholic steatohepatitis; RF, raw radio frequency; ROI, regions of interest; SD, standard deviation; T2DM, type 2 diabetes mellitus; US, ultrasound; liver fat quantification; non-alcoholic fatty liver disease; ultrasound.
© 2022 Indian National Association for Study of the Liver. Published by Elsevier B.V. All rights reserved.
Figures
Similar articles
-
Diagnostic Performance of 9 Quantitative Ultrasound Parameters for Detection and Classification of Hepatic Steatosis in Nonalcoholic Fatty Liver Disease.Invest Radiol. 2022 Jan 1;57(1):23-32. doi: 10.1097/RLI.0000000000000797. Invest Radiol. 2022. PMID: 34049335
-
Liver Fat Quantification by Ultrasound in Children: A Prospective Study.AJR Am J Roentgenol. 2021 Oct;217(4):996-1006. doi: 10.2214/AJR.20.24874. Epub 2021 Jan 13. AJR Am J Roentgenol. 2021. PMID: 33438457
-
Diagnostic performance of ultrasound hepatorenal index for the diagnosis of hepatic steatosis in children.Pediatr Radiol. 2022 Jun;52(7):1306-1313. doi: 10.1007/s00247-022-05313-x. Epub 2022 Mar 1. Pediatr Radiol. 2022. PMID: 35229183
-
Magnetic Resonance Imaging-Proton Density Fat Fraction vs. Transient Elastography-Controlled Attenuation Parameter in Diagnosing Non-alcoholic Fatty Liver Disease in Children and Adolescents: A Meta-Analysis of Diagnostic Accuracy.Front Pediatr. 2022 Jan 11;9:784221. doi: 10.3389/fped.2021.784221. eCollection 2021. Front Pediatr. 2022. PMID: 35087774 Free PMC article.
-
Usefulness of Different Imaging Modalities in Evaluation of Patients with Non-Alcoholic Fatty Liver Disease.Biomedicines. 2020 Aug 21;8(9):298. doi: 10.3390/biomedicines8090298. Biomedicines. 2020. PMID: 32839409 Free PMC article. Review.
Cited by
-
The Future Is Beyond Bright: The Evolving Role of Quantitative US for Fatty Liver Disease.Radiology. 2023 Nov;309(2):e223146. doi: 10.1148/radiol.223146. Radiology. 2023. PMID: 37934095 Free PMC article. Review.
-
Correlation Between the Inferior Vena Cava/Aorta (Ivc/Ao) Ratio and Serum Lactate Levels in Children With Renal Disorder.Int J Nephrol Renovasc Dis. 2025 Jan 22;18:43-51. doi: 10.2147/IJNRD.S488639. eCollection 2025. Int J Nephrol Renovasc Dis. 2025. PMID: 39866641 Free PMC article.
-
Protocol of quantitative ultrasound techniques for noninvasive assessing of hepatic steatosis after bariatric surgery.Front Surg. 2024 Jan 4;10:1244199. doi: 10.3389/fsurg.2023.1244199. eCollection 2023. Front Surg. 2024. PMID: 38239667 Free PMC article.
-
Altered probe pressure and body position increase diagnostic accuracy for men and women in detecting hepatic steatosis using quantitative ultrasound.Eur Radiol. 2024 Sep;34(9):5989-5999. doi: 10.1007/s00330-024-10655-1. Epub 2024 Mar 8. Eur Radiol. 2024. PMID: 38459346 Free PMC article.
References
-
- Wieckowska A., Feldstein A.E. Diagnosis of nonalcoholic fatty liver disease: invasive versus noninvasive. Semin Liver Dis. 2008;28:386–395. - PubMed
-
- Younossi Z.M., Blissett D., Blissett R., et al. The economic and clinical burden of nonalcoholic fatty liver disease in the United States and Europe. Hepatology. 2016;64:1577–1586. - PubMed
-
- Janiec D.J., Jacobson E.R., Freeth A., Spaulding L., Blaszyk H. Histologic variation of grade and stage of non-alcoholic fatty liver disease in liver biopsies. Obes Surg. 2005;15:497–501. - PubMed
LinkOut - more resources
Full Text Sources
