. 2021 Sep 28:10:979.
doi: 10.12688/f1000research.73600.2. eCollection 2021.

Doublet identification in single-cell sequencing data using scDblFinder

Affiliations

Doublet identification in single-cell sequencing data using scDblFinder

Pierre-Luc Germain et al. F1000Res. .

Abstract

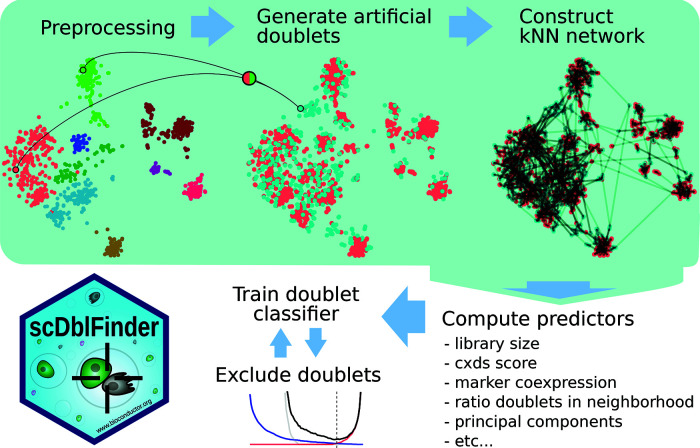
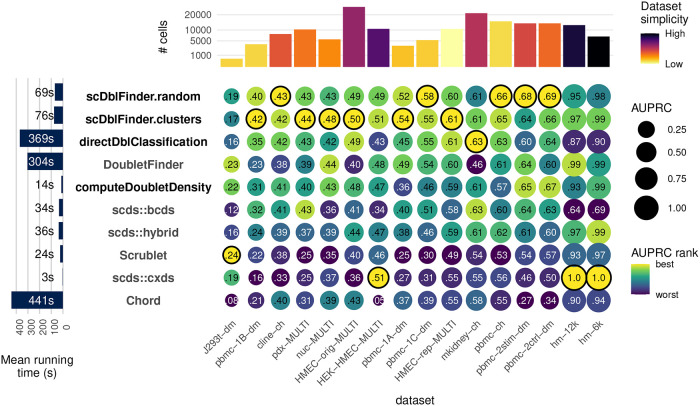
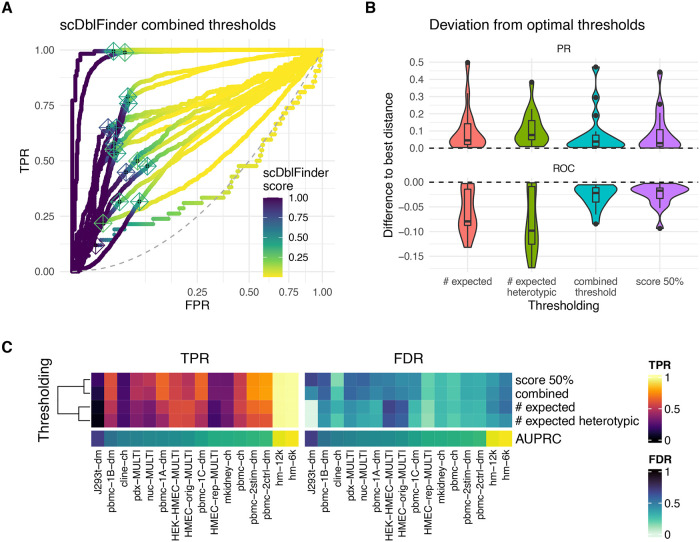
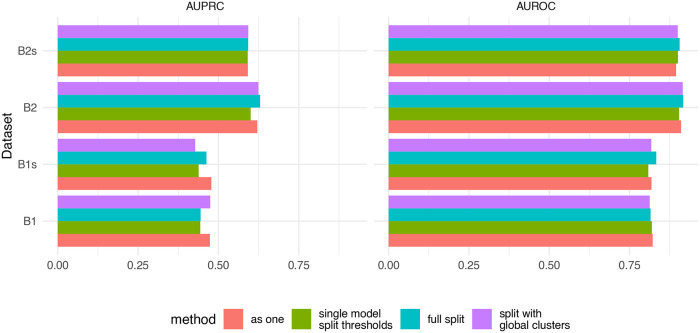
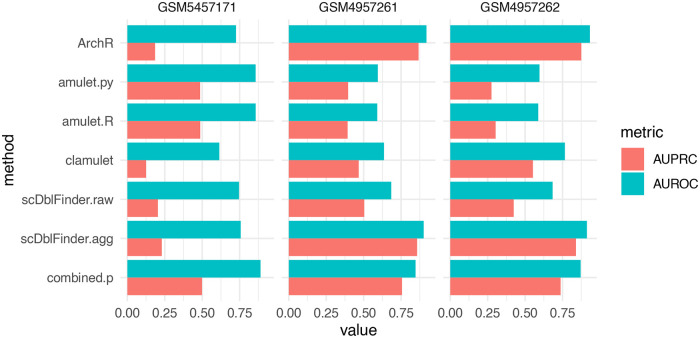
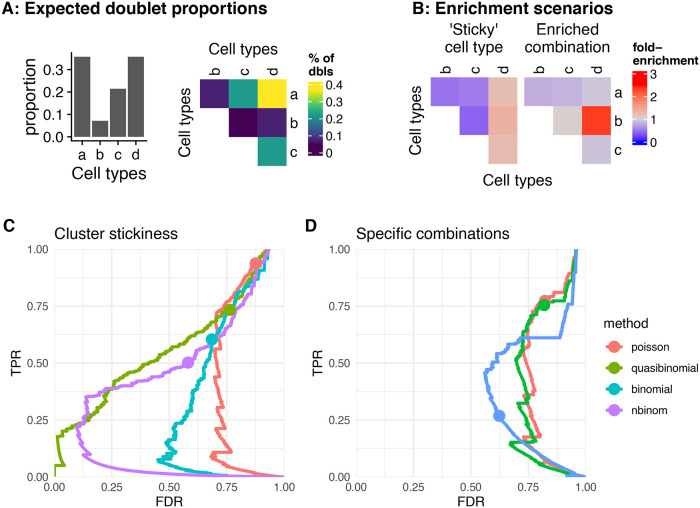
Doublets are prevalent in single-cell sequencing data and can lead to artifactual findings. A number of strategies have therefore been proposed to detect them. Building on the strengths of existing approaches, we developed scDblFinder, a fast, flexible and accurate Bioconductor-based doublet detection method. Here we present the method, justify its design choices, demonstrate its performance on both single-cell RNA and accessibility (ATAC) sequencing data, and provide some observations on doublet formation, detection, and enrichment analysis. Even in complex datasets, scDblFinder can accurately identify most heterotypic doublets, and was already found by an independent benchmark to outcompete alternatives.

Keywords: doublets; filtering; multiplets; single-cell sequencing.


Conflict of interest statement

No competing interests were disclosed.

Figures

Figure 1.
Figure 1.. Characterization of real doublets in a mixture of three human lung adenocarcinoma cell lines.
A: Observed median (and +/- one median absolute deviation in) library sizes per cell type against additive expectation for single cell and doublet types in a real dataset. The dashed line indicates the diagonal. B: Relative contribution of composing cell types in real doublets (each point represents a doublet) plotted against the expected relative contributions (based on the ratio between the median library sizes of the composing cell types). Values indicate the relative contribution of one of the two cell types to the doublet’s transcriptome. The dashed line indicates the diagonal, and the thick line indicates the weighted mean per doublet type. The annotation of cell types and their combinations comes from the original Demuxlet analysis by Tian et al., excluding ambiguous calls.
Figure 2.
Figure 2.. Overview of the scDblFinder method.
Figure 3.
Figure 3.. Benchmark.
Accuracy (area under the precision and recall curve) of doublet identification using alternative methods across 16 benchmark datasets. The colour of the dots indicates the relative ranking for the dataset, while the size and numbers indicate the actual area under the (PR) curve. For each dataset, the top method is circled in black. Methods with names in black are provided in the scDblFinder package. Running times are indicated on the left. On top the number of cells in each dataset is shown, and colored by the proportion of variance explained by the first two components (relative to that explained by the first 100), as a rough guide to dataset simplicity.
Figure 4.
Figure 4.. Doublet types and real accuracy of heterotypic doublet identification.
A: Cartoon representing the different types of doublets. Within-individual heterotypic doublets will wrongly be labeled as false positives, and between-individual homotypic will be labeled as false negatives. B: Adjusted PR curve for an example sample (GSM2560248). The two shaded areas represent the expected proportion of within-individual heterotypic doublets (i.e. wrongly labeled as singlets in the annotation used as ground truth) and between-individual homotypic doublets, respectively. The red dotted line indicates the random expectation, and the black dot indicates the threshold set by scDblFinder.
Figure 5.
Figure 5.. Thresholding.
A: ROC curves (with square-root transformation on the x axis) of the different benchmark datasets, colored by scDblFinder doublet scores, showing a rapid flip of the scores around the inflexion point. The crosses indicate the scDblFinder thresholds. B: Deviation from two ideals of thresholds based on different methods. In the PR curve, the ideal is defined as the minimal distance from the corner indicating a perfect precision and recall. In the ROC curve, the ideal is defined as the maximal distance from the diagonal. The y-axis indicates the difference between the distance at the threshold and the respective optimal distance. C: Tradeoff between True Positive Rate (TPR/sensitivity/recall) and False Discovery Rate (FDR/1-precision) using different thresholds.
Figure 6.
Figure 6.. Comparison of four multi-sample strategies.
B1 and B2 the two batches from dataset GSE96583, and contain 3 and 2 captures, respectively. The datasets with the suffix ‘s’ are versions downsampled to 30%. Using doublet detection on each capture separately (full split) was generally comparable to treating the captures as one (and adjusting the doublet rate).
Figure 7.
Figure 7.. Doublet identification in three single-nucleus ATAC-seq datasets.
‘amulet.py’ and ‘amulet. R’ respectively stand for the original and R reimplementation of the method. ‘scDblFinder.agg’ stands for the feature aggregation approach. ‘combination’ indicates a Fisher combination of the amulet. R p-value and the 1 minus the scDblFinder.agg score. For ‘ArchR,’ the DoubletEnrichment output was used.
Figure 8.
Figure 8.. Doublet enrichment analysis.
A, B: Doublet enrichment in a toy example. A: Proportion of different doublet types from random expectations based on the cell type abundances. B: The fold-enrichment over this expectation in two different doublet enrichment scenarios. C, D: Performance of the cluster stickiness tests (C) and tests for enrichment of specific combinations (D) using different underlying distributions.

References

    1. Amezquita RA, Lun ATL, Becht E, et al. : Orchestrating Single-Cell Analysis with Bioconductor. Nat. Methods. December, 1–9 2019;17:137–145. 10.1038/s41592-019-0654-x - DOI - PMC - PubMed
    1. Bais AS, Kostka D: Scds: Computational Annotation of Doublets in Single-Cell RNA Sequencing Data. Bioinformatics. 2020;36(4):1150–1158. 10.1093/bioinformatics/btz698 - DOI - PMC - PubMed
    1. Bernstein NJ, Fong NL, Lam I, et al. : Solo: Doublet Identification in Single-Cell RNA-Seq via Semi-Supervised Deep Learning. Cell Systems. 2020 June;11:95–101.e5. 10.1016/j.cels.2020.05.010 - DOI - PubMed
    1. Bloom JD: Estimating the Frequency of Multiplets in Single-Cell RNA Sequencing from Cell-Mixing Experiments. PeerJ. 2018;6(September):e5578. 10.7717/peerj.5578 - DOI - PMC - PubMed
    1. DePasquale EAK, Schnell DJ, Van Camp P-J, et al. : DoubletDecon: Deconvoluting Doublets from Single-Cell RNA-Sequencing Data. Cell Rep. 2019;29(6):1718–1727.e8. 10.1016/j.celrep.2019.09.082 - DOI - PMC - PubMed

LinkOut - more resources