

Spatial Variation of the Microbial Community Structure of On-Site Soil Treatment Units in a Temperate Climate, and the Role of Pre-treatment of Domestic Effluent in the Development of the Biomat Community
- PMID: 35814661
- PMCID: PMC9263727
- DOI: 10.3389/fmicb.2022.915856
Spatial Variation of the Microbial Community Structure of On-Site Soil Treatment Units in a Temperate Climate, and the Role of Pre-treatment of Domestic Effluent in the Development of the Biomat Community
Abstract
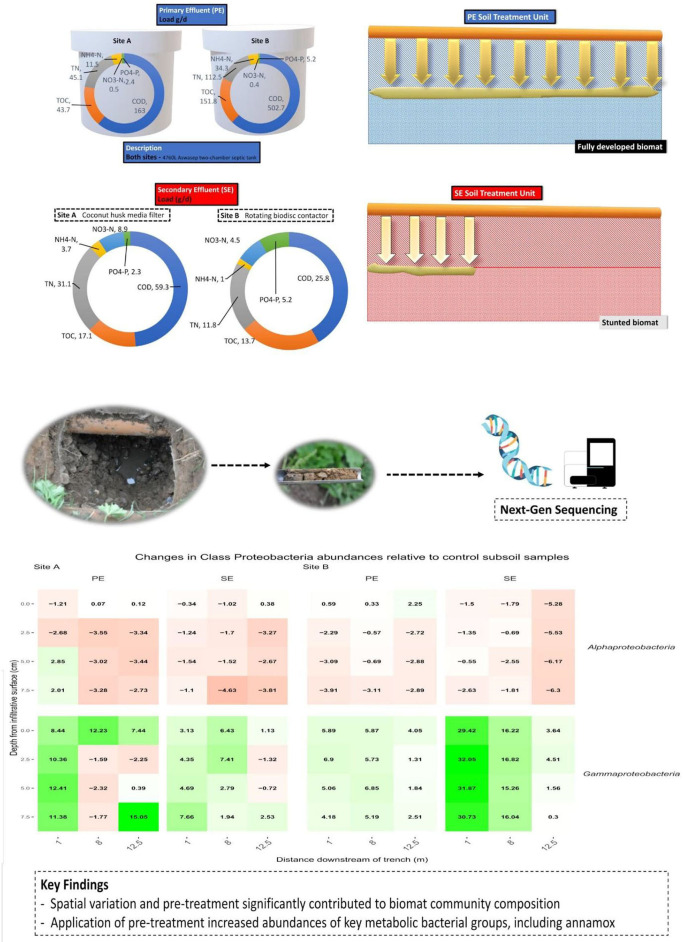
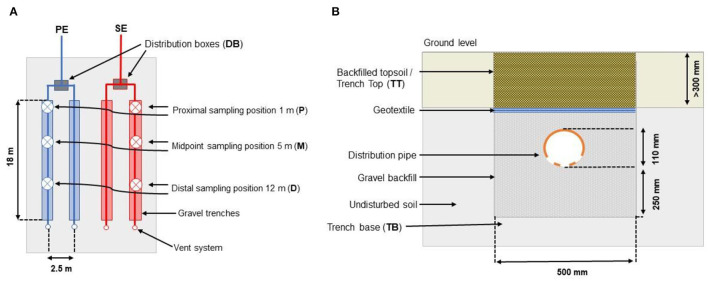
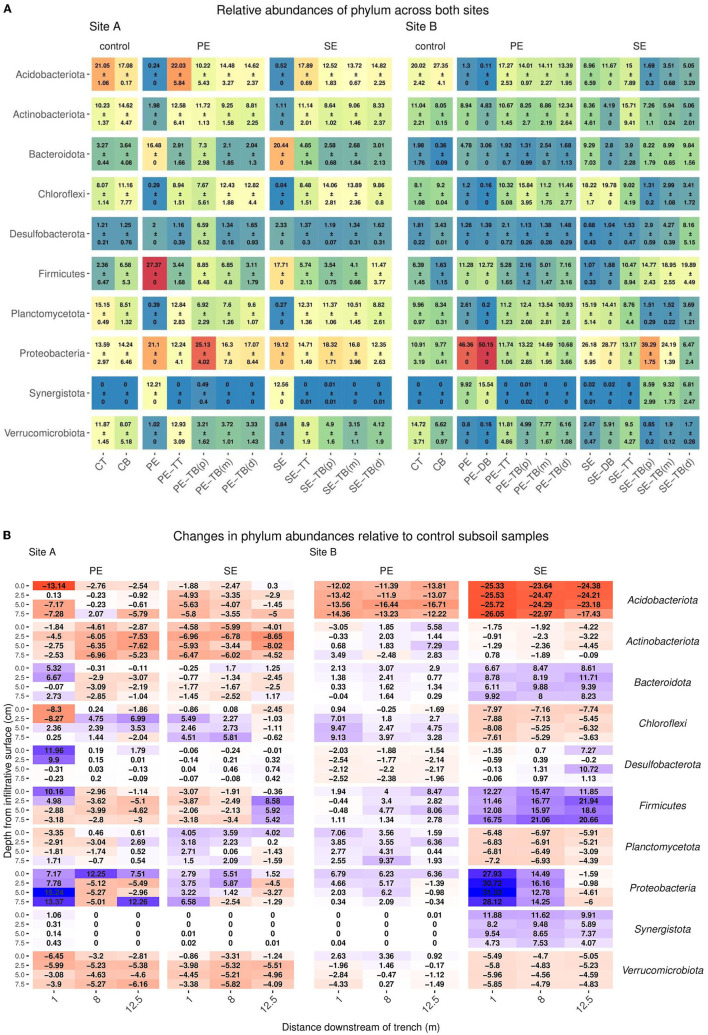
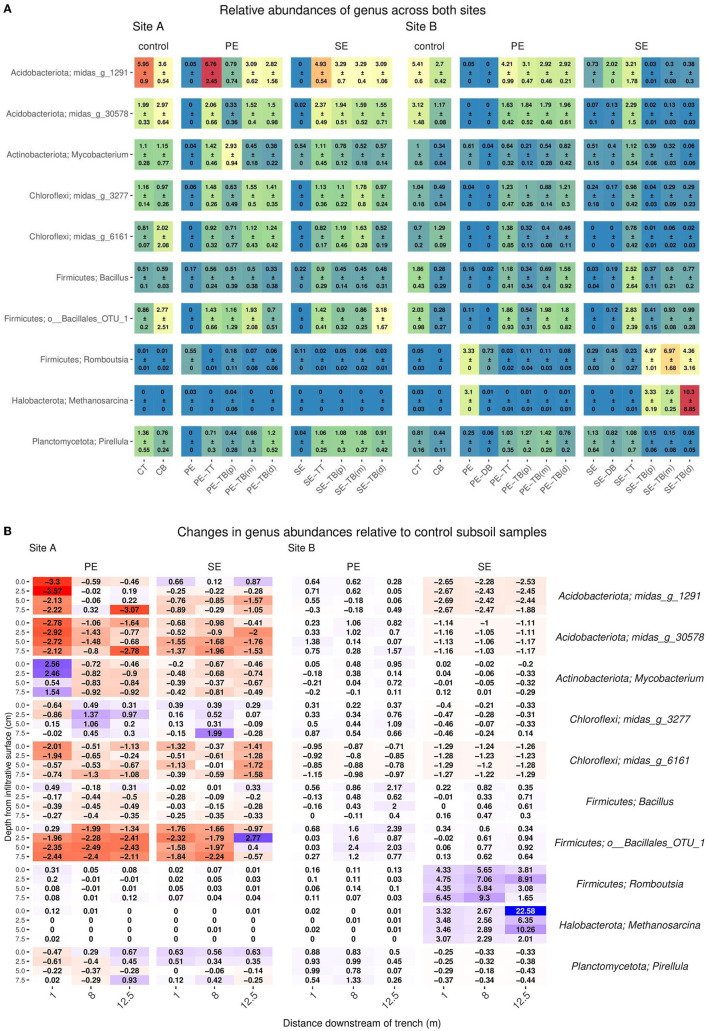
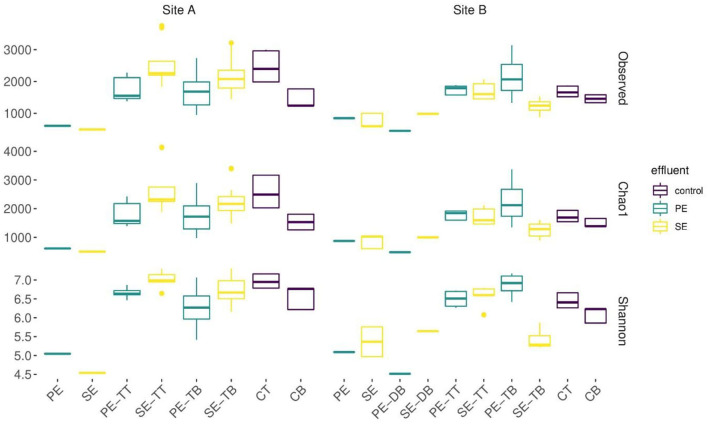
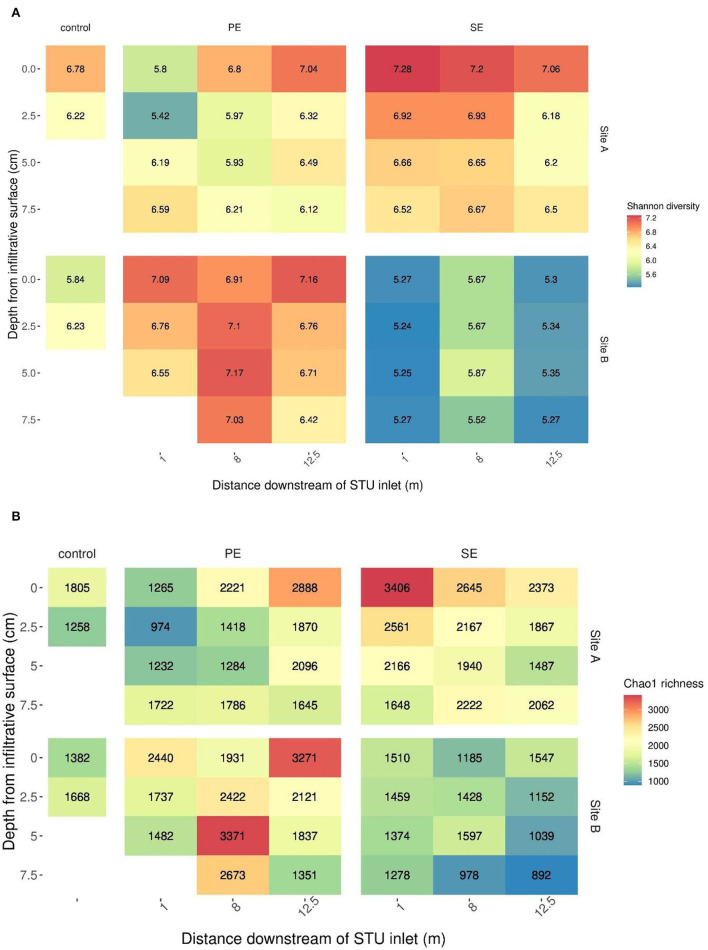
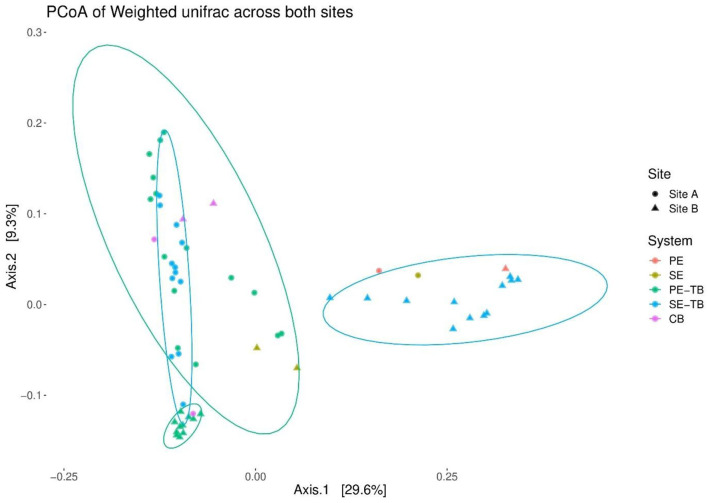
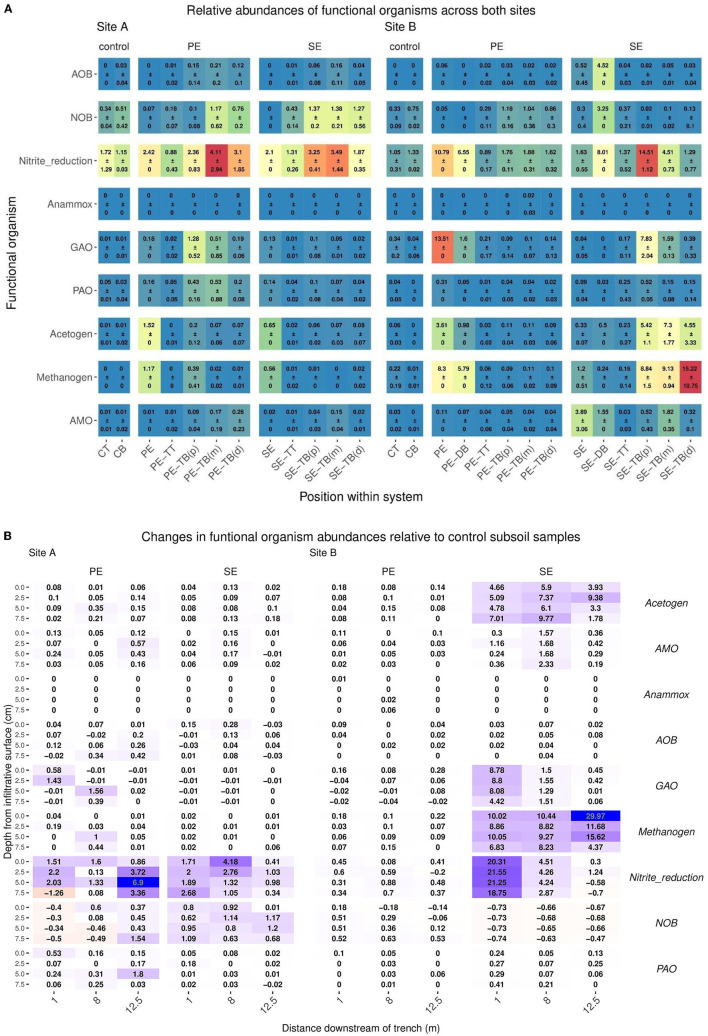
The growth of microbial mats or "biomats" has been identified as an essential component in the attenuation of pollutants within the soil treatment unit (STU) of conventional on-site wastewater treatment systems (OWTSs). This study aimed to characterize the microbial community which colonizes these niches and to determine the influence of the pre-treatment of raw-domestic wastewater on these communities. This was achieved through a detailed sampling campaign of two OWTSs. At each site, the STU areas were split whereby half received effluent directly from septic tanks, and half received more highly treated effluents from packaged aerobic treatment systems [a coconut husk media filter on one site, and a rotating biodisc contactor (RBC) on the other site]. Effluents from the RBC had a higher level of pre-treatment [~90% Total Organic Carbon (TOC) removal], compared to the media filter (~60% TOC removal). A total of 92 samples were obtained from both STU locations and characterized by 16S rRNA gene sequencing analysis. The fully treated effluent from the RBC resulted in greater microbial community richness and diversity within the STUs compared to the STUs receiving partially treated effluents. The microbial community structure found within the STU receiving fully treated effluents was significantly different from its septic tank, primary effluent counterpart. Moreover, the distance along each STU appears to have a greater impact on the community structure than the depth in each STU. Our findings highlight the spatial variability of diversity, Phylum- and Genus-level taxa, and functional groups within the STUs, which supports the assumption that specialized biomes develop around the application of effluents under different degrees of treatment and distance from the source. This research indicates that the application of pre-treated effluents infers significant changes in the microbial community structure, which in turn has important implications for the functionality of the STU, and consequently the potential risks to public health and the environment.
Keywords: bioclogging; microbial community composition; microbial community structure; microbial diversity; on-site wastewater treatment; soil treatment unit.
Copyright © 2022 Criado Monleon, Knappe, Somlai, Betancourth, Ali, Curtis and Gill.
Conflict of interest statement
The authors declare that the research was conducted in the absence of any commercial or financial relationships that could be construed as a potential conflict of interest.
Figures
Similar articles
-
The influence of pre-treatment on biomat development in soil treatment units.J Contam Hydrol. 2020 Jun;232:103654. doi: 10.1016/j.jconhyd.2020.103654. Epub 2020 May 8. J Contam Hydrol. 2020. PMID: 32504864
-
Spatio-temporal variations in the physiological profiles of streambed bacterial communities: implication of wastewater treatment plant effluents.World J Microbiol Biotechnol. 2021 Jul 17;37(8):136. doi: 10.1007/s11274-021-03106-2. World J Microbiol Biotechnol. 2021. PMID: 34273007
-
Desiccation events change the microbial response to gradients of wastewater effluent pollution.Water Res. 2019 Mar 15;151:371-380. doi: 10.1016/j.watres.2018.12.028. Epub 2018 Dec 27. Water Res. 2019. PMID: 30616049
-
Unravelling riverine microbial communities under wastewater treatment plant effluent discharge in large urban areas.Appl Microbiol Biotechnol. 2017 Sep;101(17):6755-6764. doi: 10.1007/s00253-017-8384-4. Epub 2017 Jul 5. Appl Microbiol Biotechnol. 2017. PMID: 28681108
-
Upflow anaerobic sludge blanket reactor--a review.Indian J Environ Health. 2001 Apr;43(2):1-82. Indian J Environ Health. 2001. PMID: 12397675 Review.
References
-
- Ali M., Wang Z., Salam K. W., Hari A. R., Pronk M., van Loosdrecht M. C., et al. (2019). Importance of species sorting and immigration on the bacterial assembly of different-sized aggregates in a full-scale aerobic granular sludge plant. Environ. Sci. Technol. 53, 8291–8301. 10.1021/acs.est.8b07303 - DOI - PubMed
-
- Amador J. A., Loomis G. W. (2019). Soil-Based Wastewater Treatment. New York: Wiley. 10.2134/sbwtreatment - DOI
-
- Bastida F., Torres I. F., Romero-Trigueros C., Baldrian P., Větrovsk,ý T., Bayona J. M., et al. (2017). Combined effects of reduced irrigation and water quality on the soil microbial community of a citrus orchard under semi-arid conditions. Soil Biol. Biochem. 104, 226–237. 10.1016/j.soilbio.2016.10.024 - DOI
LinkOut - more resources
Full Text Sources