

Long Term Time-Lapse Imaging of Geographic Atrophy: A Pilot Study
- PMID: 35814763
- PMCID: PMC9257004
- DOI: 10.3389/fmed.2022.868163
Long Term Time-Lapse Imaging of Geographic Atrophy: A Pilot Study
Abstract
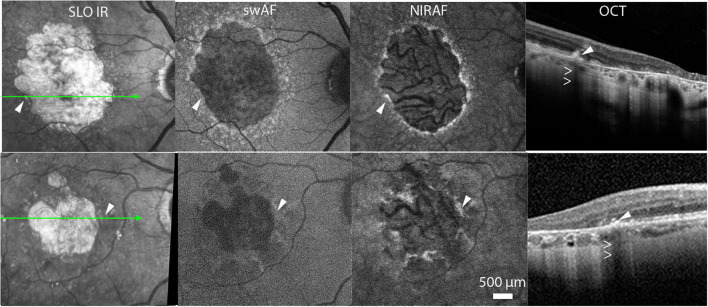
Geographic atrophy (GA), the late stage of age-related macular degeneration, is a major cause of visual disability whose pathophysiology remains largely unknown. Modern fundus imaging and histology revealed the complexity of the cellular changes that accompanies atrophy. Documenting the activity of the disease in the margins of atrophy, where the transition from health to disease occurs, would contribute to a better understanding of the progression of GA. Time-lapse imaging facilitates the identification of structural continuities in changing environments. In this retrospective pilot study, we documented the long-term changes in atrophy margins by time-lapse imaging of infrared scanning laser ophthalmoscopy (SLO) and optical coherence tomography (OCT) images in 6 cases of GA covering a mean period of 32.8 months (range, 18-72). The mean interval between imaging sessions was 2.4 months (range, 1.4-3.8). By viewing time-lapse sequences we observed extensive changes in the pattern of marginal hyperreflective spots, which associated fragmentation, increase and/or disappearance. Over the entire span of the follow-up, the most striking changes were those affecting hyperreflective spots closest to margins of atrophy, on the non-atrophic side of the retina; a continuum between the successive positions of some of the hyperreflective spots was detected, both by SLO and OCT. This continuum in their successive positions resulted in a subjective impression of a centrifugal motion of hyperreflective spots ahead of atrophy progression. Such mobilization of hyperreflective spots was detected up to several hundred microns away from atrophic borders. Such process is likely to reflect the inflammatory and degenerative process underlying GA progression and hence deserves further investigations. These results highlight the interest of multimodal time-lapse imaging to document cell-scale dynamics during progression of GA.
Clinical trial registration: clinicaltrials.gov, identifier: NCT04128150 and NCT04129021.
Keywords: age-related macular degeneration; geographic atrophy; optical coherence tomography; scanning laser ophthalmoscopy; time-lapse imaging.
Copyright © 2022 Paques, Norberg, Chaumette, Sennlaub, Rossi, Borella and Grieve.
Conflict of interest statement
The authors declare that the research was conducted in the absence of any commercial or financial relationships that could be construed as a potential conflict of interest.
Figures


References
Associated data
LinkOut - more resources
Full Text Sources
Medical