. 2022 Apr 7;23(1):26-40.
doi: 10.2174/1389202922666211110100017.

Transcriptomic Analysis Reveals Key Candidate Genes Related to Seed Abortion in Chinese Jujube (Ziziphus jujuba Mill)

Affiliations

Transcriptomic Analysis Reveals Key Candidate Genes Related to Seed Abortion in Chinese Jujube (Ziziphus jujuba Mill)

Fengxia Shao et al. Curr Genomics. .

Abstract

Background: Seed abortion is a common phenomenon in Chinese jujube that seriously hinders the process of cross-breeding. However, the molecular mechanisms of seed abortion remain unclear in jujube.

Methods: Here, we performed transcriptome sequencing using eight flower and fruit tissues at different developmental stages in Ziziphus jujuba Mill. 'Zhongqiusucui' to identify key genes related to seed abortion. Histological analysis revealed a critical developmental process of embryo abortion after fertilization.

Results: Comparisons of gene expression revealed a total of 14,012 differentially expressed genes. Functional enrichment analyses of differentially expressed genes between various sample types uncovered several important biological processes, such as embryo development, cellular metabolism, and stress response, that were potentially involved in the regulation of seed abortion. Furthermore, gene co-expression network analysis revealed a suite of potential key genes related to ovule and seed development. We focused on three types of candidate genes, agamous subfamily genes, plant ATP-binding cassette subfamily G transporters, and metacaspase enzymes, and showed that the expression profiles of some members were associated with embryo abortion.

Conclusion: This work generates a comprehensive gene expression data source for unraveling the molecular mechanisms of seed abortion and aids future cross-breeding efforts in jujube.

Keywords: Ziziphus jujuba Mill; breeding; candidate genes; embryo abortion; seed abortion; transcriptome.


Figures

Fig. (1)
Fig. (1)
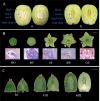
The morphological characteristics of flower buds and fruits at different developmental stages. (A) The anatomical structure of fruits in the stone hardening stage; a, fruit with normally well-developed seeds; b, fruit with abortive seeds (seed traces). (B) Flowers at different developmental stages and the corresponding microstructure of their ovules; BO, floral bud oblate stage, the arrow shows the ovule primordium in the histological section; BY, floral bud-yellowing stage, the arrow indicates the four-nucleate embryo sac in the section; SF, sepal-flattening stage, the arrow shows the eight-nucleate matured embryo sac in the section; SW, stamen-wilting stage, the arrow shows the matured embryo sac in the section; OE, ovary enlargement stage, the arrows show the ovules in the ovary section; scale bars are 2 mm (top line) and 100 μm (bottom line). (C) Fruits at different developmental stages. FrI, jujube fruits with normal seeds; FrII, jujube fruits with light embryo abortion; FrIII, jujube fruits with higher embryo abortion degree; scale bars are 2 mm (top line) and 1 cm (bottom line). (A higher resolution / colour version of this figure is available in the electronic copy of the article).
Fig. (2)
Fig. (2)
Volcano plots of the DEGs for different comparisons. (A-G) Differentially expressed gene distribution. Red dots indicate up-regulated genes, and blue dots indicate down-regulated genes for the comparisons BY-vs-Bo, SF-vs-BY, SW-vs-SF, OE-vs-SW, FrI-vs-OE, FrII-vs-FrI, and FrIII-vs-FrII. Black dots represent non-DEGs. (H) Differential gene expression. (A higher resolution / colour version of this figure is available in the electronic copy of the article).
Fig. (3)
Fig. (3)
Top 50 GO terms of DEGs enriched in different comparisons. (A) The enriched GO terms in the comparison BO-vs-BY; (B) the enriched GO terms in the comparison FrI-vs-FrII. The x-axis indicates the number of DEGs annotated to a GO term, and the y-axis shows each GO classification. (A higher resolution / colour version of this figure is available in the electronic copy of the article).
Fig. (4)
Fig. (4)
Top 20 enriched KEGG pathways of DEGs in different comparisons. (A) Dot plot representation of enriched KEGG pathways in BO-vs-BY; (B) dot plot representation of enriched KEGG pathways in FrI-vs-FrII. The x-axis indicates -log10 (Qvalue); the y-axis shows the pathway name arranged from small to large Q values; the sizes of the dots correspond to the number of DEGs in each pathway; the color of the dots corresponds to different RichFactor values (indicating the degree of KEGG enrichment). (A higher resolution / colour version of this figure is available in the electronic copy of the article).
Fig. (5)
Fig. (5)
Gene cluster dendrograms and module division. (A) Clustering dendrogram, wherein dissimilarity is based on the topological overlap, along with assigned module colors. The clustered branches represent different modules, and each line represents one gene. The dynamic tree cut represents the module divided according to the expression of each gene, and different colors represent different modules; the merged dynamic is the result of merging similar modules according to the dynamic tree cut. (B) Distribution of the number of genes in modules. The abscissa represents the modules, and the vertical ordinate represents the number of genes of each module. (A higher resolution / colour version of this figure is available in the electronic copy of the article).
Fig. (6)
Fig. (6)
Sample expression heat map. The horizontal axis represents different samples, and the vertical axis represents the eigenvectors of each module. Red indicates high expression, and green indicates low expression. (A higher resolution / colour version of this figure is available in the electronic copy of the article).
Fig. (7)
Fig. (7)
Model of the interaction of genes critical for jujube ovule and seed development. (A) Heat map generated on the basis of the RPKMs of key genes related to ovule and development during different developmental stages. (B) Potential network map. The heat map was generated from the FPKM data, which were row-scaled. The maximum/minimum value was set to ±2.0; changes in expression level are represented by changes in color. Blue indicates a lower expression level, whereas red indicates a higher expression level. (A higher resolution / colour version of this figure is available in the electronic copy of the article).
Fig. (8)
Fig. (8)
Expression profiles of key genes. (A) Heat map generated on the basis of the RPKMs of eight putative AGLs in different developmental stages. (B) Heat map generated on the basis of the RPKMs of 22 putative ABCG family genes. (C) Heat map generated on the basis of the RPKMs of seven putative MC family genes. The heat map was generated from FPKM data, which were row-scaled. The maximum/minimum value was set to ±2.0; changes in expression level are represented by changes in color. Blue indicates a lower expression level, whereas red indicates a higher expression level. (A higher resolution / colour version of this figure is available in the electronic copy of the article).
Fig. (9)
Fig. (9)
qRT-PCR verification results of 15 genes. The left axis indicates the relative expression values from qRT-PCR experiments; the right axis indicates the RNA-seq expression values in FPKM; r represents the correlation coefficient between qRT-PCR and RNA-seq expression data. (A higher resolution / colour version of this figure is available in the electronic copy of the article).

Similar articles

References

    1. Li J.W., Fan L.P., Ding S.D., Ding X.L. Nutritional composition of five cultivars of Chinese jujube. Food Chem. 2007;103(2):454–460. doi: 10.1016/j.foodchem.2006.08.016. - DOI
    1. Liu M.J. The present status, problems and countermeasures of Chinese jujube production. Rev. China Agric. Sci. Technol. 2000;2:76–80.
    1. Gao Q.H., Wu C.S., Wang M. The jujube (Ziziphus jujuba Mill.) fruit: A review of current knowledge of fruit composition and health benefits. J. Agric. Food Chem. 2013;61(14):3351–3363. doi: 10.1021/jf4007032. - DOI - PubMed
    1. Liu M.J., Wang J.R., Liu P., Zhao J., Zhao Z.H., Dai L., Li X.S., Liu Z.G. Historical achievements and frontier advances in the production and research of Chinese jujube (Ziziphus jujuba) in China. Yuan Yi Xue Bao. 2015;42(9):1683–1698.
    1. Qu Z.Z., Wang Y.H. China fruit’s monograph-Chinese jujube volume. Vol. 56. For. Publ. House: Beijing, China; 1993. p. 229.

LinkOut - more resources