. 2022 Jun 16;8(1):veac053.
doi: 10.1093/ve/veac053. eCollection 2022.

Molecular epidemiology of Porcine Parvovirus Type 1 (PPV1) and the reactivity of vaccine-induced antisera against historical and current PPV1 strains

Affiliations

Molecular epidemiology of Porcine Parvovirus Type 1 (PPV1) and the reactivity of vaccine-induced antisera against historical and current PPV1 strains

Nick Vereecke et al. Virus Evol. .

Abstract

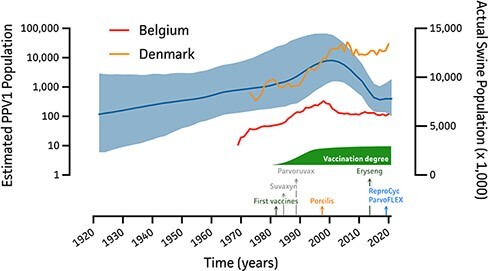
Porcine Parvovirus Type 1 (PPV1) contributes to important losses in the swine industry worldwide. During a PPV1 infection, embryos and fetuses are targeted, resulting in stillbirth, mummification, embryonic death, and infertility (SMEDI syndrome). Even though vaccination is common in gilts and sows, strains mainly belonging to the 27a-like group have been spreading in Europe since early 2000s, resulting in SMEDI problems and requiring in-depth studies into the molecular epidemiology and vaccination efficacy of commercial vaccines. Here, we show that PPV1 has evolved since 1855 [1737, 1933] at a rate of 4.71 × 10⁻⁵ nucleotide substitutions per site per year. Extensive sequencing allowed evaluating and reassessing the current PPV1 VP1-based classifications, providing evidence for the existence of four relevant phylogenetic groups. While most European strains belong to the PPV1a (G1) or PPV1b (G2 or 27a-like) group, most Asian and American G2 strains and some European strains were divided into virulent PPV1c (e.g. NADL-8) and attenuated PPV1d (e.g. NADL-2) groups. The increase in the swine population, vaccination degree, and health management (vaccination and biosafety) influenced the spread of PPV1. The reactivity of anti-PPV1 antibodies from sows vaccinated with Porcilis© Parvo, Eryseng© Parvo, or ReproCyc© ParvoFLEX against different PPV1 field strains was the highest upon vaccination with ReproCyc© ParvoFLEX, followed by Eryseng© Parvo, and Porcilis© Parvo. Our findings contribute to the evaluation of the immunogenicity of existing vaccines and support the development of new vaccine candidates. Finally, the potential roles of cluster-specific hallmark amino acids in elevated pathogenicity and viral entry are discussed.

Keywords: BEAST; evolution; molecular phylodynamics; vaccination; viral classification.


Figures

Figure 1.
Figure 1.
Comprehensive overview of the PPV1 virion. (A) Overall PPV1 capsid structure showing five-fold axes (left) and three- and two-fold (black arrows) axes (right) when centered on the pore and VP2 trimer, respectively. Capsid extrusions, dimples, and five-fold pores are colored in shades of red, gray, and dark gray, respectively; (B) Intersection of pore and VP2-trimer-centered capsid structures, showing a hypothesized VP1 peptide representation (1:5 ratio) at pore interior. Black arrows represent the two-fold dimple between two adjacent VP2 trimers; (C) VP2 trimer representation from side (left) and front (right) orientation; (D) Single VP1/VP2 structure in surface (left) and cartoon (right) representation, highlighting the four major loops (shades of red) and hypothesized VP1 peptide at its 5ʹ end (green). This additional VP1 peptide harbors three linear nuclear localization motifs (LNCM; light green) and a unique PLA2 domain (PLA2; blue). All representations are based on the 1K3V VP2 structure (Tsao et al. 1991; Simpson et al. 2002).
Figure 2.
Figure 2.
Bayesian Skygrid reconstruction of the PPV1 population in relation to Belgian and Danish swine population. On the left y-axis, the estimated PPV1 population size is shown over a time range of 1921 up to 2021, indicating the mean estimated PPV1 population size as a solid blue line and 95 per cent HPD intervals as blue shade. The right y-axis represents the actual swine population size of Belgium (red) and Denmark (orange) as available from Eurostat (February 2022). At the bottom, the first introductions of PPV1 vaccines in Belgium are shown along with the vaccination degree.
Figure 3.
Figure 3.
Time-scaled MCC tree of the PPV1 VP1 gene. All PPV1 VP1 sequences are shown indicating the suggested node origins (x-axis). Clusters were determined based on Oh et al. (2017) (colors), Zimmerman et al. (2006) (Genotypes), and Cadar et al. (2012) (Letters). New Clusters G and H are colored in green and magenta, respectively. Relevant vaccine strains and field strains using in IPMA, HI, and SN assays are indicated in bold.
Figure 4.
Figure 4.
Evaluation of cluster divergence based on intra- and inter-cluster amino acid diversities. (A) ML tree (1,000 bootstraps; GTR + G + I) of all PPV1 VP1 sequences highlighting the four biological relevant PPV1 clusters, including PPV1a (G1; orange), PPV1b (G2; blue), PPV1c (G2; green), and PPV1d (G2; pink) strains. Strains used in further analyses are shown in bold; (B–D) Trimer (left) and monomer (right) of the VP2 structure (1K3V) highlighting cluster-specific hallmarks as compared to the PPV1c NADL-8 (USA 1976) strain. Cluster- and subpopulation-specific amino acid changes are shown with solid and dotted lines, respectively. Red and blue circles highlight mutations associated with NADL-2 phenotypic attenuation (Bergeron, Hébert, and Tijssen 1996) and tissue tropism (Simpson et al. 2002), respectively; (E) Overview of new simplified PPV1-VP1-based classification system.
Figure 5.
Figure 5.
Immunogenicity of three commercial vaccines. (A) Pairwise AA identity (%) measures of all PPV1 VP1 sequences used in the serological tests are shown in a matrix, highlighting the homo- and heterologous nature of tested field strains in relation to the used commercial vaccines. Antibody titers in the antisera were determined showing (B) PPV1 specific antibodies in the IPMA (left), SN (middle), and HI (right) assays. (C) Multiple comparison plots for pairwise vaccine comparison, showing the mean antibody titer differences and 95 per cent CIs from (B); negative and positive values represent higher antibody titers in Vaccine 1 (left on y-axis) versus Vaccine 2 (right on y-axis), respectively. A value of 0 indicates that no difference in antibody titer was observed. Significance is shown as adjusted P-values based on two-way ANOVA and Tukey testing (0.05–0.01 (*), 0.01–0.001 (**), 0.001–0.0001 (***), and <0.0001 (****)). (D) ML tree of used PPV1 vaccine (bold) and field strains in relation to their VP1-Loop-4-specific mutations.

Similar articles

Cited by

References

    1. Baele G. et al. (2020) ‘Hamiltonian Monte Carlo Sampling to Estimate Past Population Dynamics Using the Skygrid Coalescent Model in a Bayesian Phylogenetics Framework’, Wellcome Open Research, 5: 53. - PMC - PubMed
    1. Baele G., Lemey P., and Suchard M. A. (2016) ‘Genealogical Working Distributions for Bayesian Model Testing with Phylogenetic Uncertainty’, Systematic Biology, 65: 250–64. - PMC - PubMed
    1. Bergeron J., Hébert B., and Tijssen P. (1996) ‘Genome Organization of the Kresse Strain of Porcine Parvovirus: Identification of the Allotropic Determinant and Comparison with Those of NADL-2 and Field Isolates’, Journal of Virology, 70: 2508–15. - PMC - PubMed
    1. Bletsa M., et al. (2019) ‘Divergence dating using mixed effects clock modelling: An application to HIV-1’, Virus Evol., 5: 1–11.doi: 10.1093/ve/vez036 - DOI - PMC - PubMed
    1. Boisvert M., Fernandes S., and Tijssen P. (2010) ‘Multiple Pathways Involved in Porcine Parvovirus Cellular Entry and Trafficking toward the Nucleus’, Journal of Virology, 84: 7782–92. - PMC - PubMed