

The glucose tolerance test in mice: Sex, drugs and protocol
- PMID: 35815375
- PMCID: PMC9795999
- DOI: 10.1111/dom.14811
The glucose tolerance test in mice: Sex, drugs and protocol
Abstract
Aim: To establish the impact of sex, dosing route, fasting duration and acute habituation stress on glucose tolerance test (GTT) measurements used in the preclinical evaluation of potential glucose-modulating therapeutics.
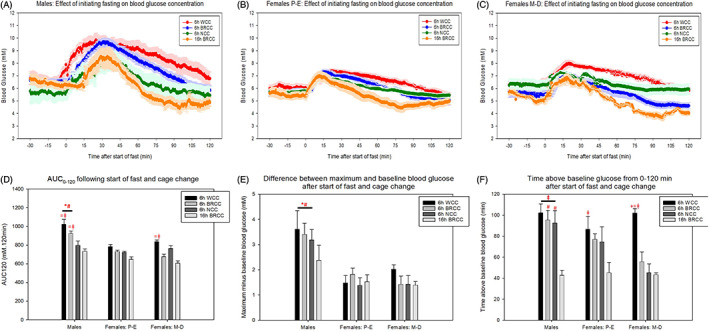
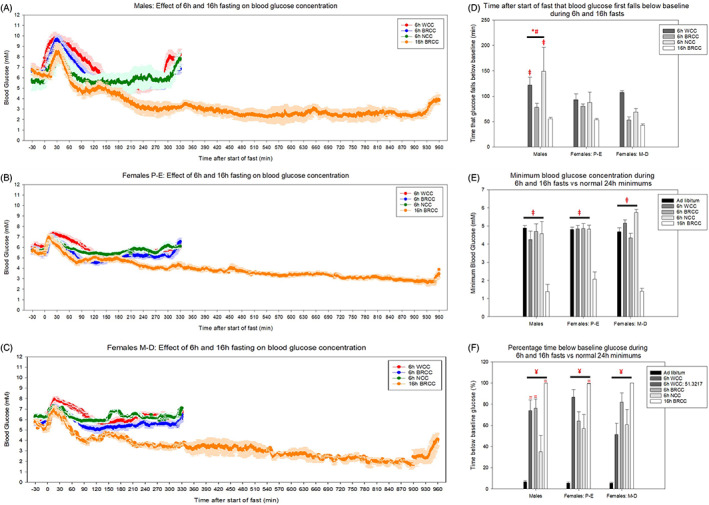
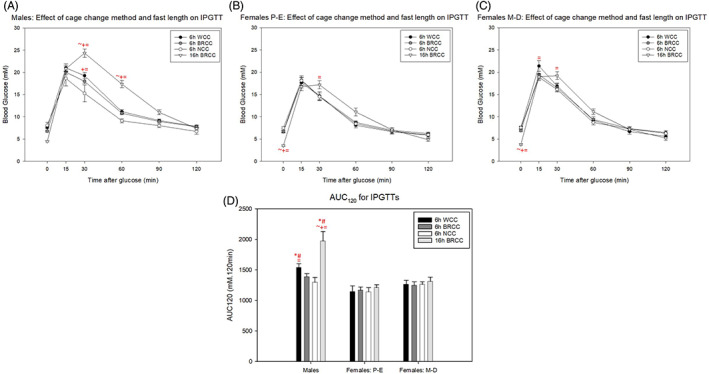
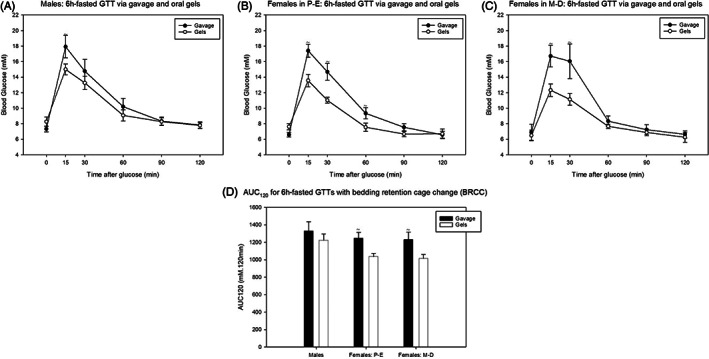
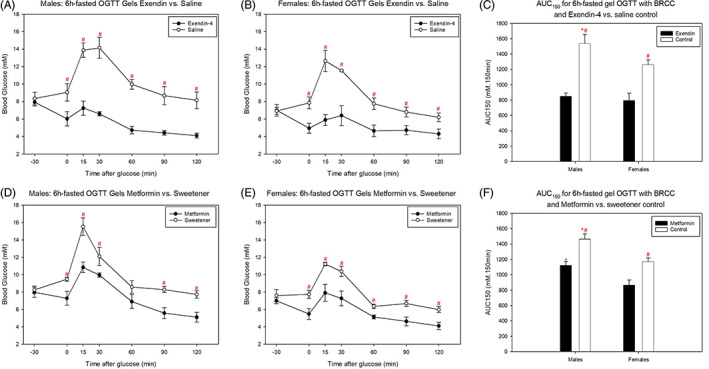
Methods: Adult male and female C57Bl/6J mice, implanted with HD-XG glucose telemetry devices, were fasted for 16 hours or 6 hours following acute habituation stress due to whole cage change, cage change with retention of used bedding or no cage change prior to intraperitoneal (IP) GTTs. To evaluate protocol refinement and sex on the ability of the GTT to detect drug effects, we administered 250 mg/kg oral metformin or 10 nmol/kg IP exendin-4 using optimized protocols.
Results: Female mice were less sensitive to human intervention when initiating fasting. Following a 6-hour fast, retention of bedding whilst changing the cage base promotes quicker stabilization of basal blood glucose in both sexes. Prolonged fasting for 16 hours resulted in an exaggerated GTT response but induced pronounced basal hypoglycaemia. Following GTT protocol optimization the effect of exendin-4 and metformin was equivalent in both sexes, with females showing a more modest but more reproducible GTT response.
Conclusions: Variations in GTT protocol have profound effects on glucose homeostasis. Protocol refinement and/or the use of females still allows for detection of drug effects, providing evidence that more severe phenotypes are not an essential prerequisite when characterizing/validating new drugs.
Keywords: animal; antidiabetic drug; continuous glucose monitoring (CGM); mouse model; pharmacology; type 2 diabetes.
© 2022 The Authors. Diabetes, Obesity and Metabolism published by John Wiley & Sons Ltd.
Conflict of interest statement
The authors declare no conflicts of interest.
Figures
Similar articles
-
Protein Extract of a Probiotic Strain of Hafnia alvei and Bacterial ClpB Protein Improve Glucose Tolerance in Mice.Int J Mol Sci. 2023 Jun 24;24(13):10590. doi: 10.3390/ijms241310590. Int J Mol Sci. 2023. PMID: 37445766 Free PMC article.
-
Not so fast: Paradoxically increased variability in the glucose tolerance test due to food withdrawal in continuous glucose-monitored mice.Mol Metab. 2023 Nov;77:101795. doi: 10.1016/j.molmet.2023.101795. Epub 2023 Aug 26. Mol Metab. 2023. PMID: 37640144 Free PMC article.
-
Comparative analysis of oral and intraperitoneal glucose tolerance tests in mice.Mol Metab. 2022 Mar;57:101440. doi: 10.1016/j.molmet.2022.101440. Epub 2022 Jan 11. Mol Metab. 2022. PMID: 35026435 Free PMC article.
-
The use of mice in diabetes research: The impact of experimental protocols.Diabet Med. 2021 Dec;38(12):e14705. doi: 10.1111/dme.14705. Epub 2021 Oct 13. Diabet Med. 2021. PMID: 34596274 Review.
-
Exenatide: an incretin mimetic for the treatment of type 2 diabetes mellitus.Clin Ther. 2006 May;28(5):652-65. doi: 10.1016/j.clinthera.2006.05.006. Clin Ther. 2006. PMID: 16861088 Review.
Cited by
-
Evaluation of Sex Differences in Preclinical Pharmacology Research: How Far Is Left to Go?Pharmaceuticals (Basel). 2023 May 24;16(6):786. doi: 10.3390/ph16060786. Pharmaceuticals (Basel). 2023. PMID: 37375734 Free PMC article. Review.
-
Glucokinase activator improves glucose tolerance and induces hepatic lipid accumulation in mice with diet-induced obesity.Liver Res. 2023 Jun 2;7(2):124-135. doi: 10.1016/j.livres.2023.05.003. eCollection 2023 Jun. Liver Res. 2023. PMID: 39958949 Free PMC article.
-
Anemoside B4 Exerts Hypoglycemic Effect by Regulating the Expression of GLUT4 in HFD/STZ Rats.Molecules. 2023 Jan 18;28(3):968. doi: 10.3390/molecules28030968. Molecules. 2023. PMID: 36770636 Free PMC article.
-
Exendin-4 affects calcium signalling predominantly during activation and activity of beta cell networks in acute mouse pancreas tissue slices.Front Endocrinol (Lausanne). 2024 Jan 16;14:1315520. doi: 10.3389/fendo.2023.1315520. eCollection 2023. Front Endocrinol (Lausanne). 2024. PMID: 38292770 Free PMC article.
-
Low-Dose Chidamide Treatment Displays Sex-Specific Differences in the 3xTg-AD Mouse.Biomolecules. 2023 Aug 29;13(9):1324. doi: 10.3390/biom13091324. Biomolecules. 2023. PMID: 37759724 Free PMC article.
References
-
- McGuinness OP, Ayala JE, Laughlin MR, Wasserman DH. NIH experiment in centralized mouse phenotyping: the Vanderbilt experience and recommendations for evaluating glucose homeostasis in the mouse. Am J Physiol: Endocrinol Metab. 2009;297(4):E849‐E855. doi:10.1152/ajpendo.90996.2008 - DOI - PMC - PubMed
Publication types
MeSH terms
Substances
Grants and funding
LinkOut - more resources
Full Text Sources
Medical
