

Schwann cell precursors represent a neural crest-like state with biased multipotency
- PMID: 35815410
- PMCID: PMC9434083
- DOI: 10.15252/embj.2021108780
Schwann cell precursors represent a neural crest-like state with biased multipotency
Abstract
Schwann cell precursors (SCPs) are nerve-associated progenitors that can generate myelinating and non-myelinating Schwann cells but also are multipotent like the neural crest cells from which they originate. SCPs are omnipresent along outgrowing peripheral nerves throughout the body of vertebrate embryos. By using single-cell transcriptomics to generate a gene expression atlas of the entire neural crest lineage, we show that early SCPs and late migratory crest cells have similar transcriptional profiles characterised by a multipotent "hub" state containing cells biased towards traditional neural crest fates. SCPs keep diverging from the neural crest after being primed towards terminal Schwann cells and other fates, with different subtypes residing in distinct anatomical locations. Functional experiments using CRISPR-Cas9 loss-of-function further show that knockout of the common "hub" gene Sox8 causes defects in neural crest-derived cells along peripheral nerves by facilitating differentiation of SCPs towards sympathoadrenal fates. Finally, specific tumour populations found in melanoma, neurofibroma and neuroblastoma map to different stages of SCP/Schwann cell development. Overall, SCPs resemble migrating neural crest cells that maintain multipotency and become transcriptionally primed towards distinct lineages.
Keywords: Schwann cell lineage; Schwann cell precursors; multipotency; neural crest; regulons.
©2022 The Authors. Published under the terms of the CC BY 4.0 license.
Figures
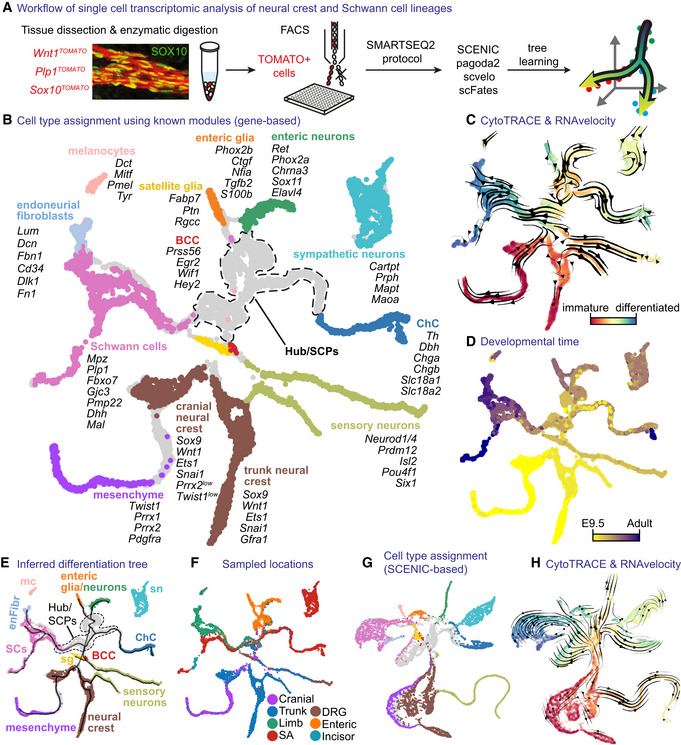
- A
Overview of single‐cell sampling, transcriptomic analysis and developmental tree assembly.
- B
Gene expression‐based UMAP embedding. Cells assigned to defined cell types using shown markers.
- C
UMAP with CytoTRACE values and overlaid RNA velocity‐derived vector streams.
- D
UMAP with developmental stage.
- E
UMAP embedding as in (B) with overlaid learned tree.
- F
UMAP embedding with sampled locations.
- G
UMAP embedding based on SCENIC activity scores (same colouring as B).
- H
SCENIC‐based UMAP with the same information as (C).
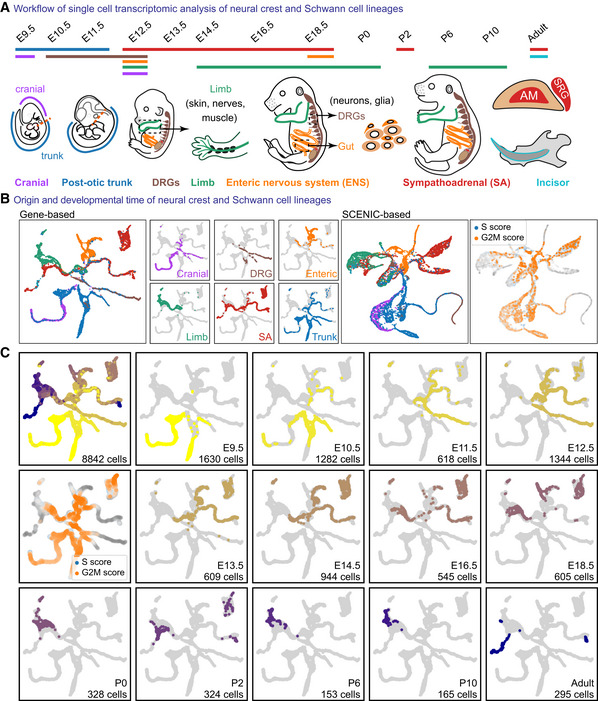
- A
Overview of the sampled locations and time points in mice. AM, adrenal medulla; SRG, suprarenal ganglion.
- B
Colour‐coded projections of the tissue of origin, including SCENIC regulon‐based UMAP embedding, with cell cycle shown (right).
- C
UMAP embeddings colour‐coded according to the developmental stage, with cell cycle shown.
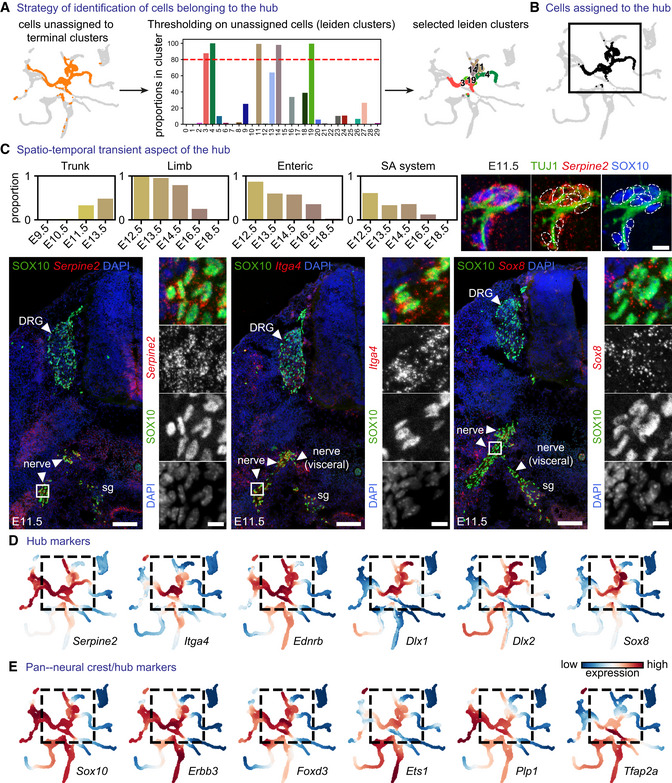
- A
Strategy of “hub” identification: Leiden clusters containing ≥ 80% of unassigned cells (red dashed lined demarcating the cutoff for clusters characterised by ≥ 80% of unassigned cells that were considered as “hub”).
- B
Cells assigned to the “hub.”
- C
Proportion of “hub” cells across sampling locations and developmental stage and (Cox et al, 2004) validation of the “hub” gene signature using SOX10 as a pan‐”hub” marker and RNAscope® in situ hybridization for Serpine2, Itga4 and Sox8. Upper right: SOX10+ cells expressing “hub” markers associate with peripheral nerves at E11.5. Scale bar in overview pictures is 100 μm and 10 μm in insets. Scale bar for upper right subpanel = 10 μm.
- D
MAGIC‐imputed expression of selected markers among the top 25 differentially expressed in “hub” cells.
- E
MAGIC‐imputed expression of known neural crest markers. SA system: sympathoadrenal system.
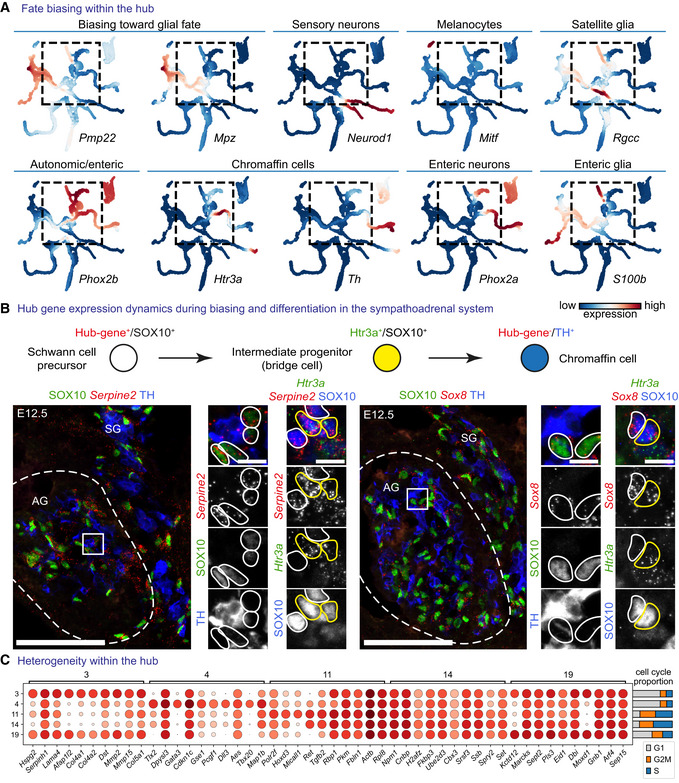
- A
MAGIC‐imputed markers of fate‐biasing within the “hub.”
- B
RNAscope® in situ hybridization for “hub” genes Serpine2 and Sox8 in the developing adrenal gland combined with immunohistochemistry for SOX10 (progenitors—Schwann cell precursors (SCPs)), TH (differentiated chromaffin cells) or RNAscope® for committed SCPs towards chromaffin fate—Htr3a. Scale bar in overview pictures (left) is 100 and 10 μm in insets (right).
- C
Dot plot of top eight differentially expressed genes between Leiden clusters within the “hub.”
- A
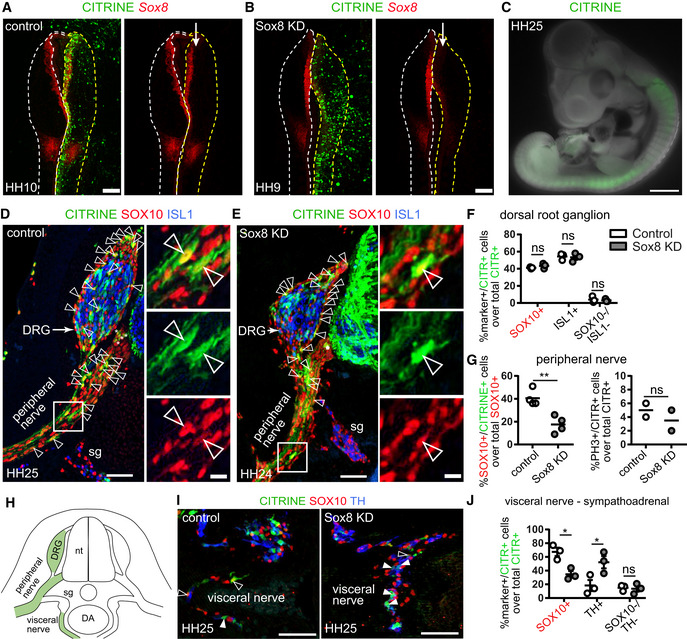
Electroporation of the control CRISPR‐Cas9 plasmid (CITRINE+ cells) does not affect Sox8 expression as seen by HCR against Sox8. The arrow points to the unilaterally electroporated side of the embryo. Scale bar = 200 μm.
- B
Validation of Sox8 knock down (KD) using the CRISPR‐Cas9 plasmid containing a Sox8 guide RNA by HCR. The arrow points to the unilaterally electroporated side of the embryo. Scale bar = 200 μm.
- C
CITRINE+ (electroporated) cells found migrating away from the neural tube after 3 days of culture following unilateral electroporation. Scale bar = 1 mm.
- D, E
Immunofluorescence against CITRINE (electroporated cells), SOX10 (Schwann cell precursors and Schwann cells) and ISL1 (sensory and sympathetic neurons) on embryos electroporated with either control CRISPR plasmid (D) or a CRISPR plasmid containing a guide RNA against Sox8 (E). CITRINE+ cells populate the developing dorsal root ganglia (DRG) and peripheral nerves. Examples of CITRINE+/SOX10+ cells shown by arrowheads. Asterisks show ventral boundary cap glia. Scale bar is 50 μm in overviews and 10 μm in insets.
- F
Quantification of the fate distribution of CITRINE+ cells as a % between glial (SOX10+) cells, sensory neurons (ISL1+) or neither (SOX10−/ISL1−) in the DRG of control and Sox8KD chick embryos and Sox8KD chick embryos. Biological replicates – N = 3 embryos per condition (wild‐type versus Sox8 KD). Data represented as mean ± SEM. Statistical significance determined using the Holm–Sidak method (α = 0.05; multiple t‐tests, unpaired). SOX10+ cells: P = 0.7901, ISL1+ cells: P = 0.9206, SOX10−/ISL1− cells: P = 0.9206. For statistical significance: nonsignificant P‐value ≥ 0.05.
- G
Quantification of (left) the % of SOX10+ cells in the peripheral nerves that are CITRINE+ in control and Sox8KD chick embryos and (right) the % of PH3+ CITRINE+ cells corresponding to proliferative cells. Biological replicates – N = 4 embryos per condition for SOX10+ distribution and N = 2 for PH3 quantification (wild‐type versus Sox8 KD). Data represented as mean ± SEM. Statistical significance determined unpaired t‐test with two‐tailed P‐value. SOX10+ cells: P = 0.0044, PH3+ cells: P = 0.4929. For statistical significance: nonsignificant P‐value ≥ 0.05, **P‐value < 0.01.
- H
Schematic representation of analysed anatomical locations.
- I
Immunofluorescence against CITRINE (electroporated cells), SOX10 (Schwann cell precursors and Schwann cells) and TH (sympathetic neurons and chromaffin cells) of the sympathoadrenal domain on control and Sox8KD embryos. CITRINE+/SOX10+ cells shown by empty arrowheads while CITRINE+/TH+ cells are shown by filled arrowheads. Scale bar = 50 μm.
- J
Quantification of the fate distribution of CITRINE+ cells as a % between glial (SOX10+) cells, chromaffin cells (TH+) or neither (SOX10−/TH−) in the proximity of the dorsal aorta and visceral nerve of wild‐type and Sox8 KD chick embryos. Biological replicates – N = 4 embryos per condition. Data represented as mean ± SEM. Statistical significance determined using the Holm–Sidak method (α = 0.05; multiple t‐tests, unpaired). SOX10+ cells: P = 0.0067, TH+ cells: P = 0.0067, SOX10−/TH− cells: P = 0.8819. For statistical significance: nonsignificant P‐value ≥ 0.05, *P‐value < 0.05.
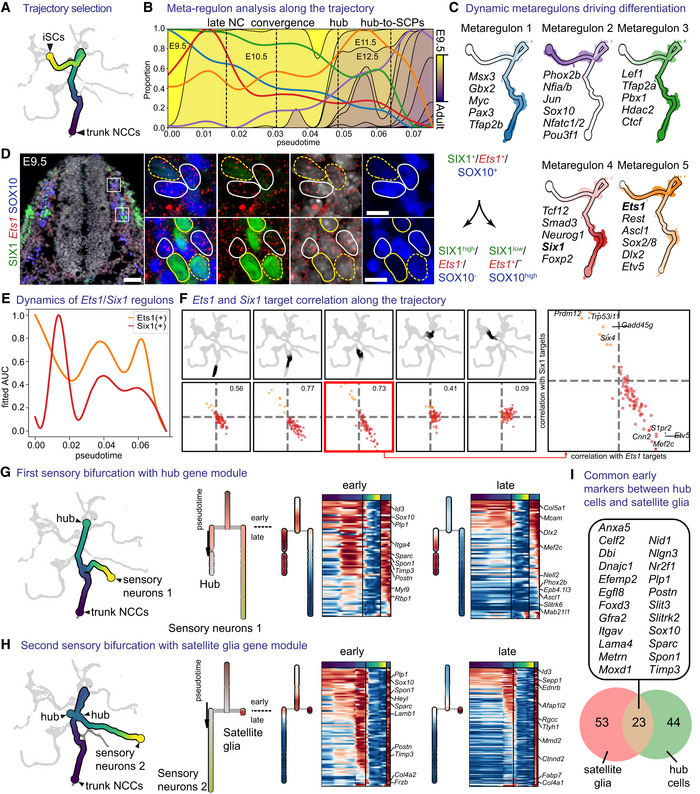
- A
Subset of the tree containing the trajectory of trunk neural crest to immature Schwann cells.
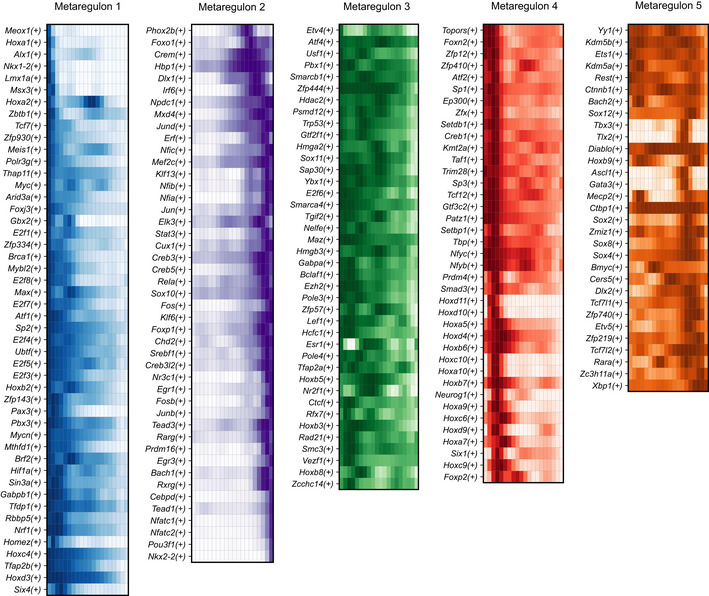
- B
Progression of the metaregulons over the trajectory selected in (A), combined with developmental time. A metaregulon is the mean expression of all regulons composing a cluster over pseudotime.
- C
Trajectory coloured by metaregulons, with a selection of regulons composing them.
- D
Validation of SIX1 and Ets1 as markers for biasing towards sensory and glia fates, respectively. Scale bar is 50 μm in the overview picture and 10 μm in the insets. Stainings were repeated on two separate occasions on two embryos from the same litter. Cells surrounded by solid white lines correspond to SIX1-/Ets1+/SOX10+ SCPs or glial fate-biased progenitors, while cells surrounded by dashed yellow lines SIX1+/Ets1- or low/SOX10- or low sensory fate-biased progenitors.
- E
Normalised regulon activity scores of Ets1 and Six1 over the trajectory.
- F
Inter‐/intra‐correlation analysis of the target genes of Ets1 and Six1 regulons on nonintersecting windows of cells over the trajectory.
- G, H
Bifurcation analysis over two successive sensory branches, highlighting the early and late genes biasing towards “hub” cells (G) and satellite glia (H).
- I
Venn diagram of early genes expressed in the bifurcation between “hub” and satellite glia. Gene list shows the common genes between the two.
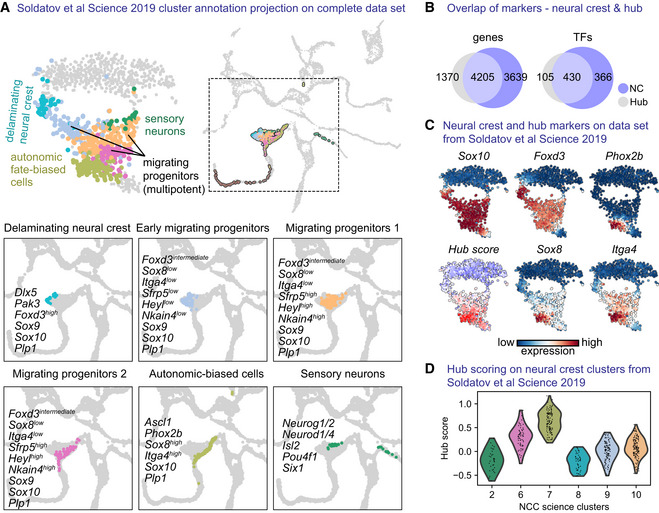
- A
tSNE embedding and annotated clusters from Soldatov et al (2019), overlayed onto the UMAP embedding containing our own data set.
- B
Venn diagram showing genes and transcription factors (TFs) positively regulated when comparing, respectively, neural crest cells and “hub” cells to the rest of the cells of the data set (Wilcoxon rank‐sum test).
- C
“hub” scoring on previous data set using gene scoring from the top 25 differentially expressed genes specific to the “hub.”
- D
Violin plot of “hub” score over the published annotated clusters.
- A
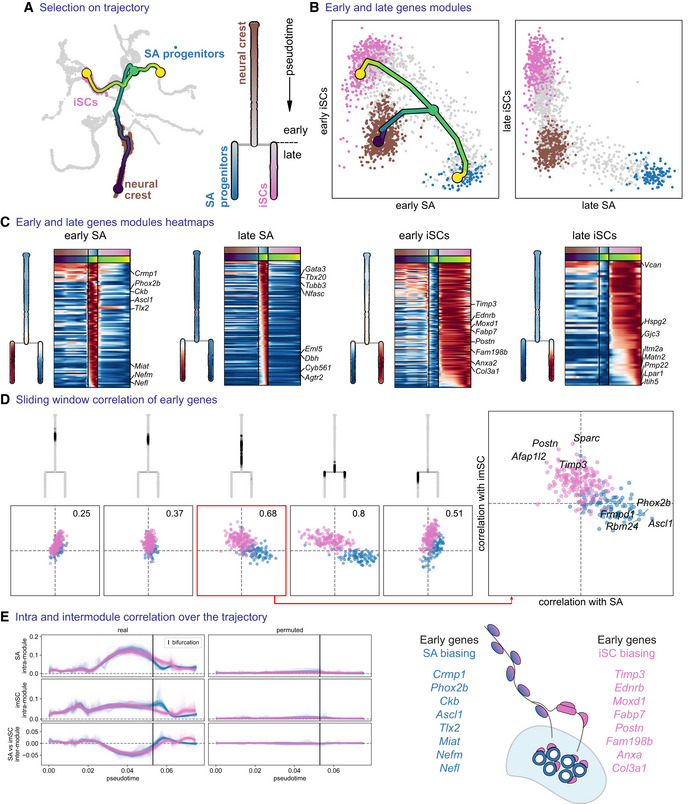
Subset tree selection of the trajectory from trunk NCCs to immature Schwann cells versus sympathoadrenal progenitors. An abstract dendrogram is displayed on the right.
- B
Mean expression of early and late gene modules for each branch and overlayed tree on the early gene modules.
- C
Heatmap of early and late genes for each branch, with mean expression shown on the dendrogram representations.
- D
Inter‐/intra‐correlation analysis of early gene modules of both branches, on nonintersecting windows of cells over the trajectory.
- E
Inter‐ and intra‐module correlation performed on a sliding window of cells (over 100 probabilistic mappings of the trajectory) along the pseudotime axis. iSCs, immature Schwann cells; SA progenitors, sympathoadrenal progenitors.
- A
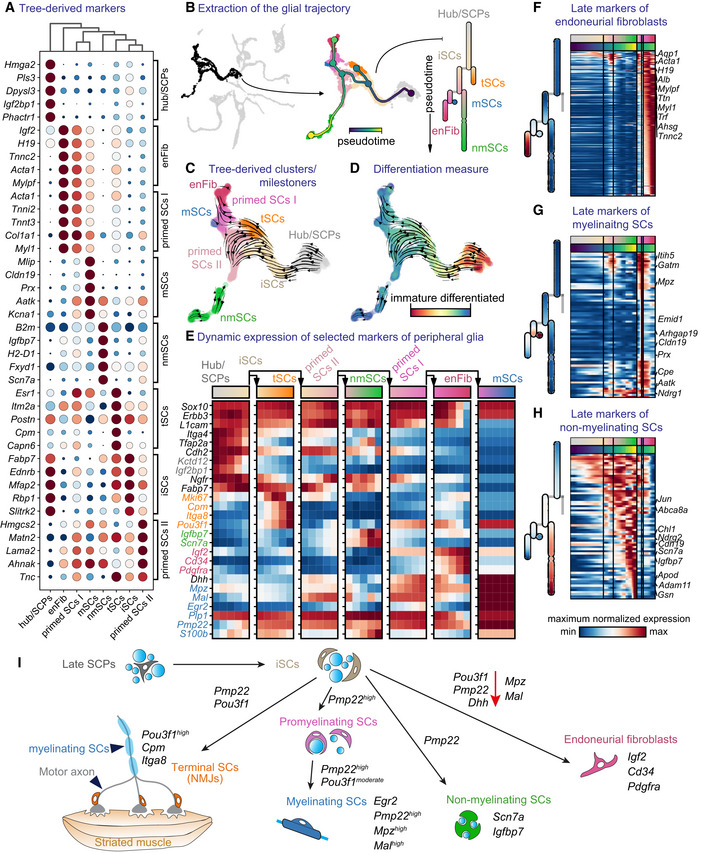
Dot plot of the top five differentially expressed genes from the milestones of the glial trajectory.
- B
Left: selected cells (Foster et al, 2020) of the glial trajectory, middle: constructed tree overlayed on the UMAP, right: abstract dendrogram.
- C
RNA velocity on tree‐derived clusters (milestones).
- D
RNA velocity with CytoTRACE overlayed on the UMAP.
- E
Dynamics of expression of known markers over the trajectory summarised over five bins per segment of the tree.
- F–H
Heatmap of late markers of the three endpoints of differentiation from immature Schwann cells: endoneurial fibroblasts (F) and myelinating (G) or nonmyelinating Schwann cells (H).
- I
Schematic representation of transitions from late “hub” cells biased to immature Schwann cells to all end fates along with mixed motor and sensory nerves.
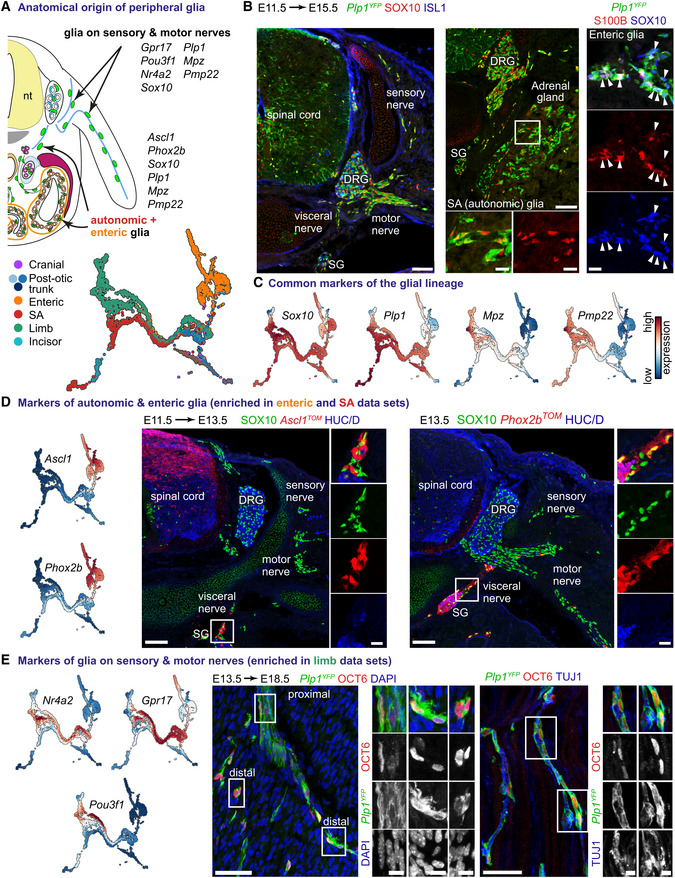
- A
Transcriptional code of peripheral glial cells of various anatomical locations.
- B
Immunofluorescent staining against SOX10 (a marker of all peripheral glia) and ISL1 (neuronal marker; left panel) or S100B (a marker of a subset of peripheral glia) and SOX10 (right panel) on E11.5 to E15.5 Plp1 CreERT2 ;R26 YFP trunk in various anatomical locations. Scale bar in the overview pictures is 100 and 10 μm in insets. Arrowheads point to SOX10+/S100B+ enteric glia.
- C
UMAPs of classical genes shared in peripheral glia.
- D
Left: UMAPs of Ascl1 and Phox2b expression. Right: Immunofluorescent staining against SOX10, Ascl1 TOM or Phox2b TOM (lineage tracing of autonomic and enteric glia) and HUC/D (neuronal marker) on E13.5 trunk in various anatomical locations. Scale bar in overview pictures is 100 and 10 μm in insets.
- E
Left: UMAPs of genes enriched in peripheral glia sampled from the developing limbs. Middle: Immunofluorescent staining against OCT6 (encoded by Pou3f1) and TUJ1 (axonal marker; left panel) on hindlimbs of E13.5 to E18.5 Plp1 CreERT2 ;R26 YFP trunk showing the various levels of OCT6 immunoreactivity and variable morphology of Plp1 YFP+/OCT6+ cells along the motor nerves. Scale bar in overview pictures is 50 and 10 μm in insets. Stainings were repeated on two separate occasions on multiple embryos from the same litter.
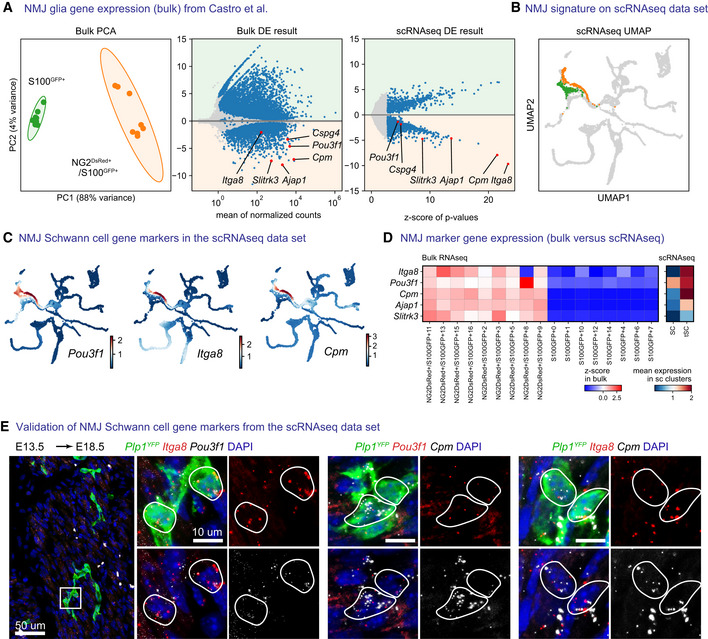
- A
Re‐analysis of bulk RNA sequencing data of S100GFP+ cells and NG2dsRED+/S100GFP+ cells isolated from adult neuromuscular junctions from Castro et al (2020) with PCA plot (left) or DESeq2 differential gene expression analysis (center) and comparison of differential expression results (right) from Leiden clusters of terminal Schwann cells and fate‐biased Schwann cells in our own data set.
- B
Leiden clusters defining terminal Schwann cells (orange) and fate‐biased Schwann cells (Green et al, 2017).
- C
MAGIC‐imputed expression of Pou3f1, Itga8 and Cpm on UMAP embeddings.
- D
Comparison of five terminal Schwann cells markers, as z‐scores on bulk data per sample (left) and as mean expression in the Leiden clusters shown in (A and B) in our own data set (right).
- E
RNAscope in situ hybridization validation of Pou3f1, Itga8 and Cpm as markers of terminal Schwann cells at E18.5 combined with immunofluorescence against Plp1 YFP on hindlimbs of an embryo injected with tamoxifen at E13.5. Stainings were repeated on two separate occasions on multiple embryos from the same litter.
References
-
- Abdo H, Calvo‐Enrique L, Lopez JM, Song J, Zhang MD, Usoskin D, El Manira A, Adameyko I, Hjerling‐Leffler J, Ernfors P (2019) Specialized cutaneous Schwann cells initiate pain sensation. Science 365: 695–699 - PubMed
-
- Adameyko I, Lallemend F, Aquino JB, Pereira JA, Topilko P, Muller T, Fritz N, Beljajeva A, Mochii M, Liste I et al (2009) Schwann cell precursors from nerve innervation are a cellular origin of melanocytes in skin. Cell 139: 366–379 - PubMed
MeSH terms
Grants and funding
LinkOut - more resources
Full Text Sources
Molecular Biology Databases
