. 2022 Jul 11:11:e75181.
doi: 10.7554/eLife.75181.

Cancer type classification using plasma cell-free RNAs derived from human and microbes

Affiliations

Cancer type classification using plasma cell-free RNAs derived from human and microbes

Shanwen Chen et al. Elife. .

Abstract

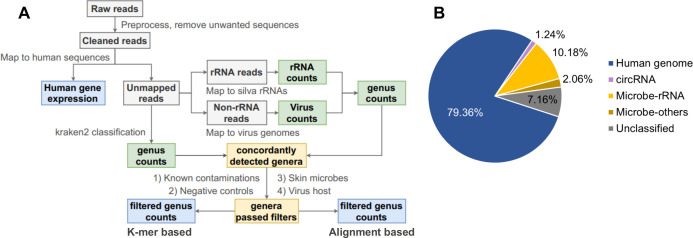
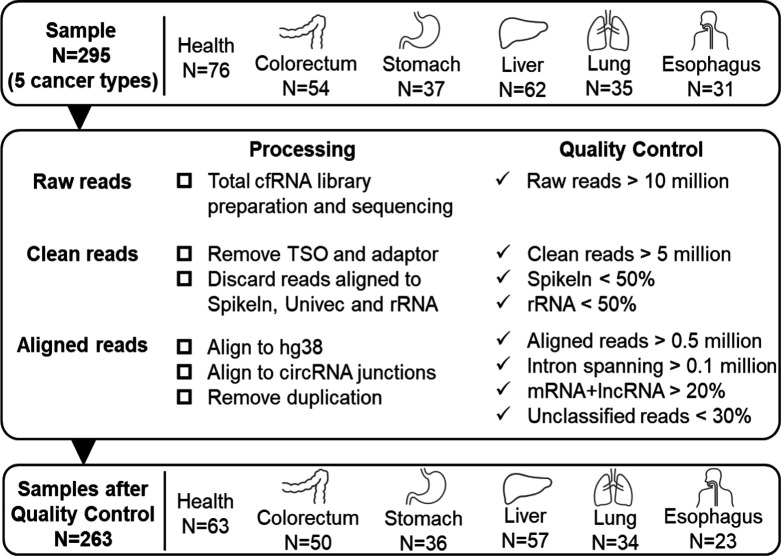
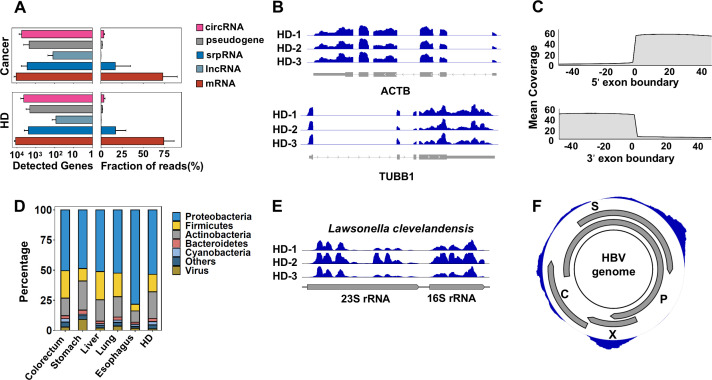
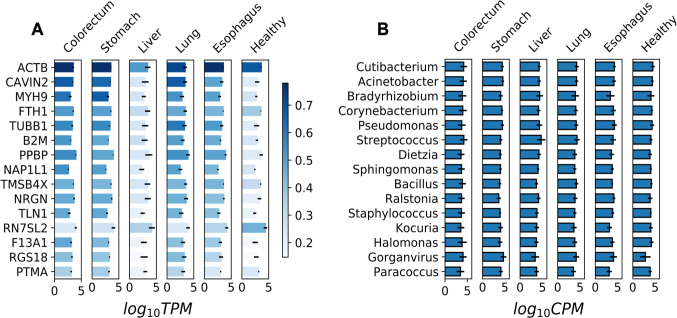
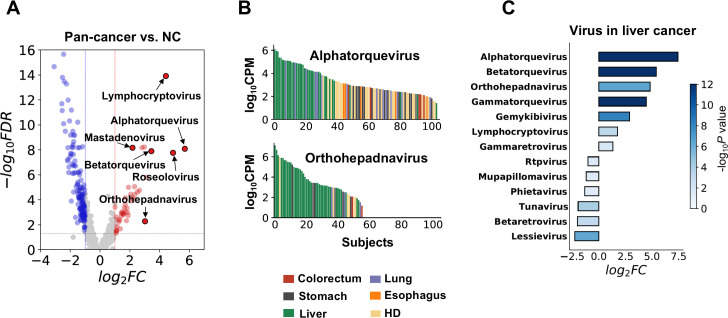
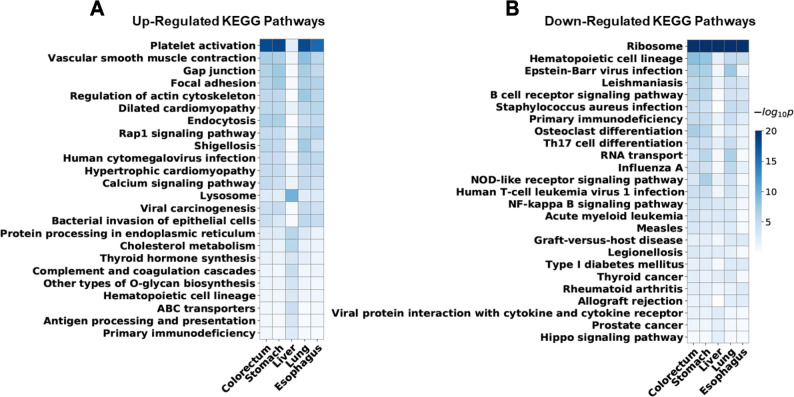
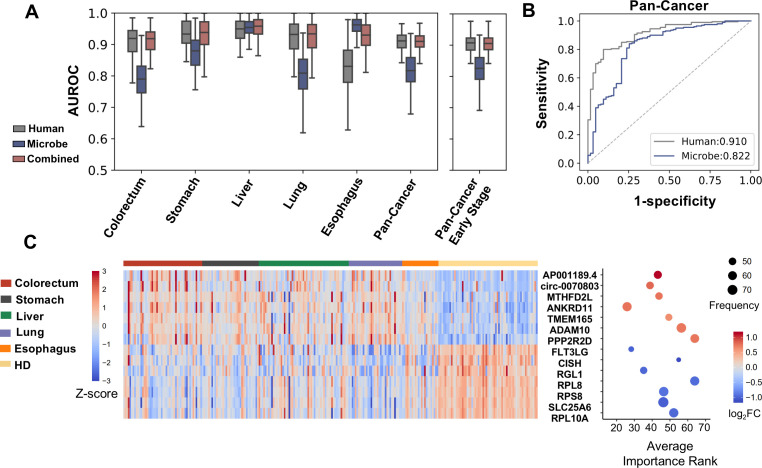
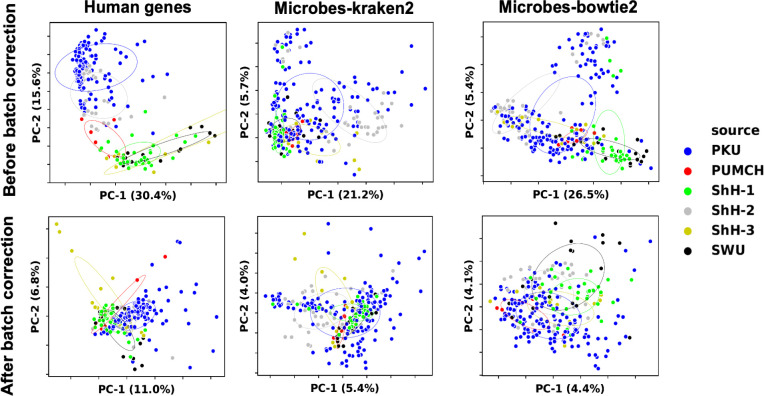
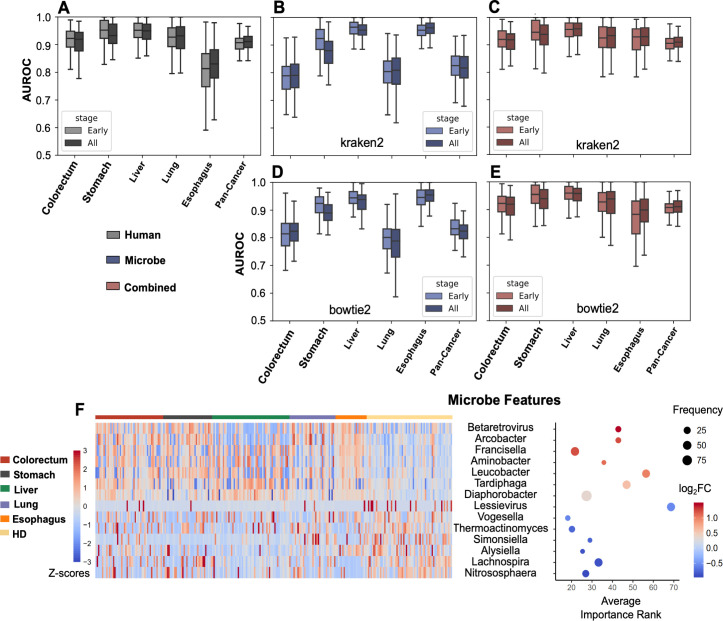
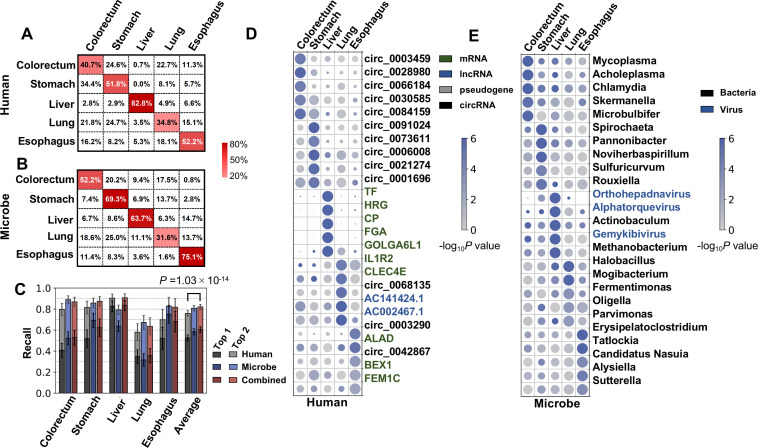
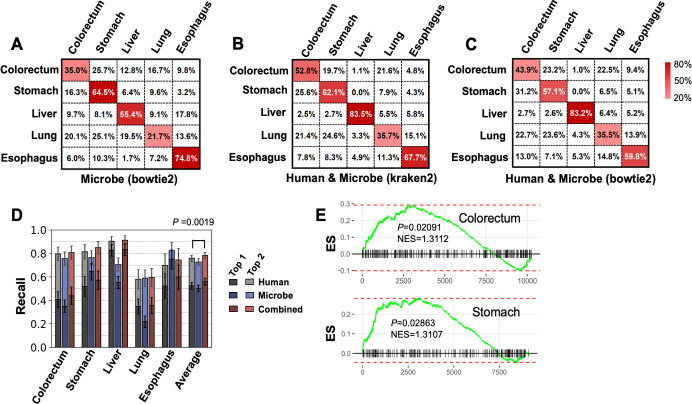
The utility of cell-free nucleic acids in monitoring cancer has been recognized by both scientists and clinicians. In addition to human transcripts, a fraction of cell-free nucleic acids in human plasma were proven to be derived from microbes and reported to have relevance to cancer. To obtain a better understanding of plasma cell-free RNAs (cfRNAs) in cancer patients, we profiled cfRNAs in ~300 plasma samples of 5 cancer types (colorectal cancer, stomach cancer, liver cancer, lung cancer, and esophageal cancer) and healthy donors (HDs) with RNA-seq. Microbe-derived cfRNAs were consistently detected by different computational methods when potential contaminations were carefully filtered. Clinically relevant signals were identified from human and microbial reads, and enriched Kyoto Encyclopedia of Genes and Genomes pathways of downregulated human genes and higher prevalence torque teno viruses both suggest that a fraction of cancer patients were immunosuppressed. Our data support the diagnostic value of human and microbe-derived plasma cfRNAs for cancer detection, as an area under the ROC curve of approximately 0.9 for distinguishing cancer patients from HDs was achieved. Moreover, human and microbial cfRNAs both have cancer type specificity, and combining two types of features could distinguish tumors of five different primary locations with an average recall of 60.4%. Compared to using human features alone, adding microbial features improved the average recall by approximately 8%. In summary, this work provides evidence for the clinical relevance of human and microbe-derived plasma cfRNAs and their potential utilities in cancer detection as well as the determination of tumor sites.

Keywords: biomarker; cancer classification; cell-free RNA; computational biology; genetics; genomics; human; liquid biopsy; microbiome; systems biology.


Conflict of interest statement

SC, YJ, SW, SX, YW, YT, YM, SZ, XL, YH, HC, YL, FX, CX, JY, XW, ZL, NZ, ZZ, ZL, PW No competing interests declared

Figures

Figure 1.
Figure 1.. Pipeline for cell-free RNA (cfRNA) sequencing data processing.
(A) The bioinformatic pipeline for plasma cfRNA sequencing data processing. After adapter trimming, spike in, potential vector contaminations, and human rRNA sequences were removed. Cleaned reads were aligned to the human genome and circular RNA back-spliced junctions. Unmapped reads were classified with a k-mer-based pipeline and an alignment-based pipeline. Genera detected by both pipelines were used for downstream analysis. Potential contaminations (known common laboratory contaminants, genera detected in control samples, skin microbes, and suspicious viral genera) were excluded. See the Materials and methods section for details. (B) Average fractions of different cfRNA components in cleaned reads. Microbe-rRNA refers to reads annotated to rRNA. Microbe-others refers to non-rRNA reads that were assigned to microbial genomes by kraken2.
Figure 1—figure supplement 1.
Figure 1—figure supplement 1.. Quality control of sequencing data.
We used 295 samples of 5 cancer patients and healthy donors to discover potential RNA biomarkers. 263 samples passed the following quality control criteria: (1) Raw reads: at least 10 million. (2) Clean reads: at least 5 million. Spike-in sequence: <50%. rRNA sequence: <50%. (3) Aligned reads (reads mapped to the human genome or circRNA junctions): at least 0.5 million; Intron-spanning reads: at least 0.1 million; reads assigned to mRNA and lncRNA: at least 20%; unclassified reads (reads cannot be assigned to annotated exon, intron, antisense of exons, promoter, enhancer, or repeats): less than 30%.
Figure 2.
Figure 2.. Human genes and microbial signals revealed by cell-free RNA (cfRNA)-seq.
(A) The number of detected human transcripts (counts per million >2) of different RNA types and their relative abundances. (B). Representative coverages for ACTB and TUBB1 in healthy donors (HDs) from three clinical centers (samples HD-1, HD-2, and HD-3 are provided by PKU, ShH-1, and SWU, respectively). (C). Metagene plot for read coverage around 5’ exon boundaries and 3’ exon boundaries. The mean coverage of 100 nt around exon boundaries for exons with read coverage >3 is shown. (D). Relative abundance of reads assigned to different phyla by kraken2. (E). Representative read coverage of Lawsonella clevelandensis 16S and 23S rRNA in healthy donors from three clinical centers. (F). A representative read coverage on the HBV genome in cfRNA of a patient with liver cancer.
Figure 2—figure supplement 1.
Figure 2—figure supplement 1.. Most abundant human genes and microbial genera in plasma cell-free (cfRNA) libraries.
(A) The abundance (log10TPM) of the 15 most abundant human genes in different sample groups. TPM: transcripts per million. (B) The abundance (log10CPM) of the 15 most abundant genera in different sample groups. CPM: counts per million.
Figure 3.
Figure 3.. Biological relevance of alterations in the microbial cell-free RNA (cfRNA) profile.
(A) Example genera with significantly altered abundance in cancer patients when compared to healthy donors (HDs). FC: fold change. FDR: false discovery rate. FC and FDR were calculated using the result of the alignment-based method, and labeled genera were supported by both pipelines. (B) Abundance of Alphatorquevirus and Othohepavirus in the alignment-based pipeline across different samples ranked in descending order; colors indicate different sample groups. (C) Virus genera with significant abundance alterations (FDR <0.05 and log2fold-change >1) in liver cancer patients when compared to HDs.
Figure 3—figure supplement 1.
Figure 3—figure supplement 1.. Enriched Kyoto Encyclopedia of Genes and Genomes (KEGG) pathways of differentially expressed human genes for each cancer type.
For five cancer types, the top 10 most significantly enriched KEGG pathways of upregulated and downregulated genes were identified. Union of these pathways was visualized. Rows for enriched pathways, columns for different cancer types, and colors indicate significance of the enrichment. Enriched pathways of liver cancer are relatively distinct from other cancer types, which may reflect some of its unique properties.
Figure 4.
Figure 4.. Cell-free RNA (cfRNA) features for cancer detection.
(A) Performance (AUROC) on the holdout dataset in 100 rounds of bootstrap resampling using abundance of human gene expression, microbe abundance (kraken2’s results), and combining both data for the binary classification (cancer patients vs. healthy donors). (B) Out-of-bag ROC curve using human or microbe features. For each sample, the median value of probabilities predicted by classifiers fitted in bootstrap replicates that reserved this sample in the testing set was utilized to generate the ROC curve. (C) Recurrent features with top fold changes when combining human and microbe features for bootstrap analysis. The left panel depicts Z scores of the expression levels in different subjects. The right panel illustrates their average importance ranks, frequency of identified as top 50 features, and fold change compared to healthy donors.
Figure 4—figure supplement 1.
Figure 4—figure supplement 1.. Data normalization for machine learning.
We used RUVg to remove unwanted variations from trimmed mean of M-values (TMM) normalized gene expression and genus abundance. The 25% most insignificant features between different sample groups in discovery set reported by edgeR’s ANOVA test were used as empirical controls. Data variations among different samples before (upper) and after (lower) RUVg processing were visualized with principal component analysis (PCA). Colors indicate different clinical centers.
Figure 4—figure supplement 2.
Figure 4—figure supplement 2.. Binary classification for cancer detection.
(A–E) Bootstrapping AUROC on holdout set. (A) Performance of human genes, stratified by cancer stages. (B–C) Performance of microbe features (B) and combined both microbe and human features (C) using kraken2’s results. (D–E) Performance of microbe features (D) and combined both microbe and human features (E) using bowtie2’s results. (F) Recurrently selected features with top fold changes when only considering microbe data for cancer vs. healthy donor (HD) classification.
Figure 5.
Figure 5.. Cancer classification using human and microbial cell-free RNAs (cfRNAs).
(A–B) Confusion matrix of human (A) and microbe (B) features averaged across bootstrap replicates. (C) Top 1 and top 2 recall for each cancer type in multiclass classification. The statistical significance was determined by a one-tailed Mann-Whitney U test. (D–E) Recurrent human (D) and microbe (E) features with the top fold change in multiclass classification. The sizes and colors of the circles indicate the relative abundances (bowtie2 result, scaled to 0–1) and p values in the one vs. rest comparisons, respectively.
Figure 5—figure supplement 1.
Figure 5—figure supplement 1.. Performance for multiclass classification.
(A–C) Confusion matrices for microbe features using bowtie2 pipeline (A), combine microbe and human features using kraken2 pipeline (B) and bowtie2 pipeline (C), and averaged across 100 bootstrap replicates. (D) Top 1 and top 2 recall of human and microbe features using bowtie2’s results. The statistical significance was determined by one-tailed Mann–Whitney U test. (E) Gene set enrichment analysis (GSEA) for the enrichment of up to 300 circular RNAs (circRNAs) that upregulated in stomach cancer and colorectum cancer. circRNAs were ranked by fold change in tumor tissue vs. normal tissue comparison using mioncocirc data. ES: enrichment score; NES: normalized enrichment score.

Similar articles

Cited by

References

    1. Abbosh C, Birkbak NJ, Wilson GA, Jamal-Hanjani M, Constantin T, Salari R, Le Quesne J, Moore DA, Veeriah S, Rosenthal R, Marafioti T, Kirkizlar E, Watkins TBK, McGranahan N, Ward S, Martinson L, Riley J, Fraioli F, Al Bakir M, Grönroos E, Zambrana F, Endozo R, Bi WL, Fennessy FM, Sponer N, Johnson D, Laycock J, Shafi S, Czyzewska-Khan J, Rowan A, Chambers T, Matthews N, Turajlic S, Hiley C, Lee SM, Forster MD, Ahmad T, Falzon M, Borg E, Lawrence D, Hayward M, Kolvekar S, Panagiotopoulos N, Janes SM, Thakrar R, Ahmed A, Blackhall F, Summers Y, Hafez D, Naik A, Ganguly A, Kareht S, Shah R, Joseph L, Marie Quinn A, Crosbie PA, Naidu B, Middleton G, Langman G, Trotter S, Nicolson M, Remmen H, Kerr K, Chetty M, Gomersall L, Fennell DA, Nakas A, Rathinam S, Anand G, Khan S, Russell P, Ezhil V, Ismail B, Irvin-Sellers M, Prakash V, Lester JF, Kornaszewska M, Attanoos R, Adams H, Davies H, Oukrif D, Akarca AU, Hartley JA, Lowe HL, Lock S, Iles N, Bell H, Ngai Y, Elgar G, Szallasi Z, Schwarz RF, Herrero J, Stewart A, Quezada SA, Peggs KS, Van Loo P, Dive C, Lin CJ, Rabinowitz M, Aerts HJWL, Hackshaw A, Shaw JA, Zimmermann BG, TRACERx consortium. PEACE consortium. Swanton C. Phylogenetic ctDNA analysis depicts early-stage lung cancer evolution. Nature. 2017;545:446–451. doi: 10.1038/nature22364. - DOI - PMC - PubMed
    1. Anders S, Pyl PT, Huber W. HTSeq--a Python framework to work with high-throughput sequencing data. Bioinformatics (Oxford, England) 2015;31:166–169. doi: 10.1093/bioinformatics/btu638. - DOI - PMC - PubMed
    1. Arbuthnot P, Kew M. Hepatitis B virus and hepatocellular carcinoma. International Journal of Experimental Pathology. 2001;82:77–100. doi: 10.1111/j.1365-2613.2001.iep0082-0077-x. - DOI - PMC - PubMed
    1. Best MG, Sol N, Kooi I, Tannous J, Westerman BA, Rustenburg F, Schellen P, Verschueren H, Post E, Koster J, Ylstra B, Ameziane N, Dorsman J, Smit EF, Verheul HM, Noske DP, Reijneveld JC, Nilsson RJA, Tannous BA, Wesseling P, Wurdinger T. RNA-Seq of Tumor-Educated Platelets Enables Blood-Based Pan-Cancer, Multiclass, and Molecular Pathway Cancer Diagnostics. Cancer Cell. 2015;28:666–676. doi: 10.1016/j.ccell.2015.09.018. - DOI - PMC - PubMed
    1. Blauwkamp TA, Thair S, Rosen MJ, Blair L, Lindner MS, Vilfan ID, Kawli T, Christians FC, Venkatasubrahmanyam S, Wall GD, Cheung A, Rogers ZN, Meshulam-Simon G, Huijse L, Balakrishnan S, Quinn JV, Hollemon D, Hong DK, Vaughn ML, Kertesz M, Bercovici S, Wilber JC, Yang S. Analytical and clinical validation of a microbial cell-free DNA sequencing test for infectious disease. Nature Microbiology. 2019;4:663–674. doi: 10.1038/s41564-018-0349-6. - DOI - PubMed

Publication types

Associated data