

Molecular Subclasses of Clear Cell Ovarian Carcinoma and Their Impact on Disease Behavior and Outcomes
- PMID: 35816189
- PMCID: PMC9777703
- DOI: 10.1158/1078-0432.CCR-21-3817
Molecular Subclasses of Clear Cell Ovarian Carcinoma and Their Impact on Disease Behavior and Outcomes
Abstract
Purpose: To identify molecular subclasses of clear cell ovarian carcinoma (CCOC) and assess their impact on clinical presentation and outcomes.
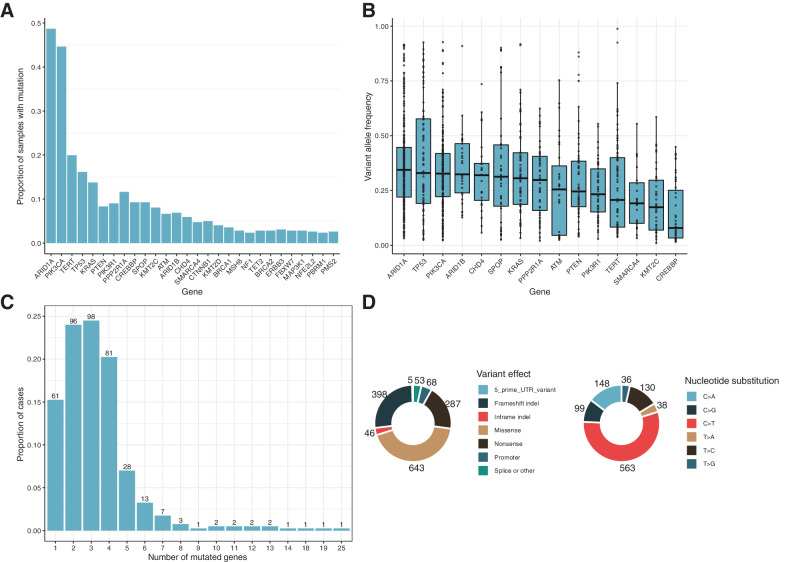
Experimental design: We profiled 421 primary CCOCs that passed quality control using a targeted deep sequencing panel of 163 putative CCOC driver genes and whole transcriptome sequencing of 211 of these tumors. Molecularly defined subgroups were identified and tested for association with clinical characteristics and overall survival.
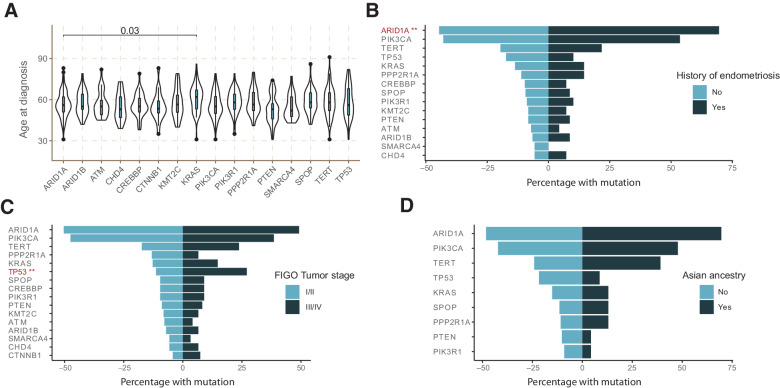
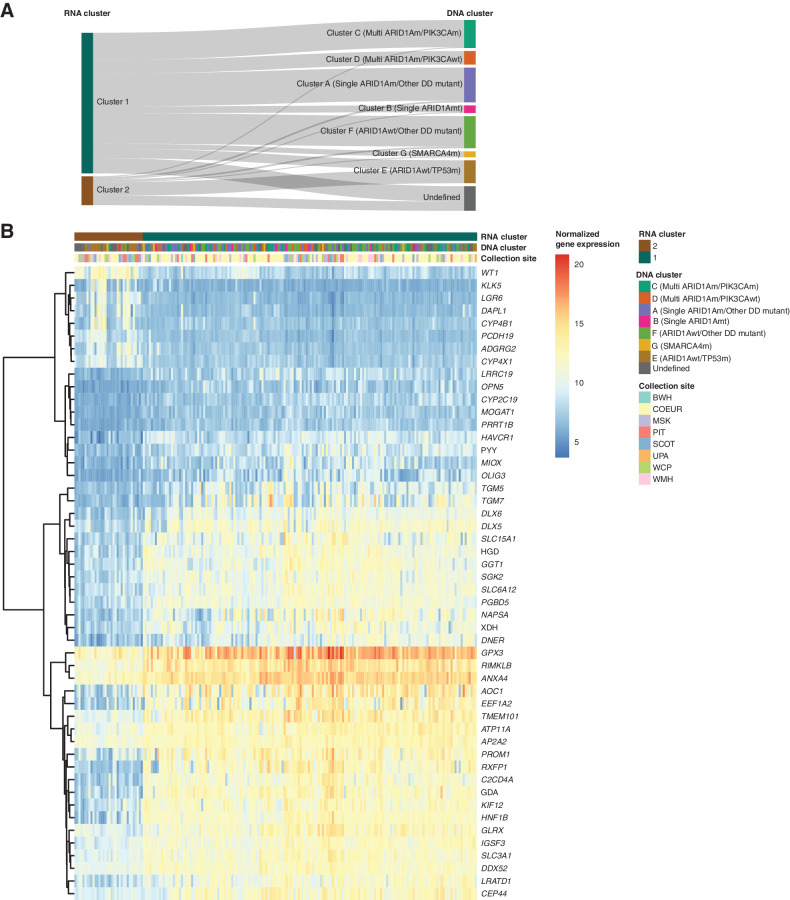
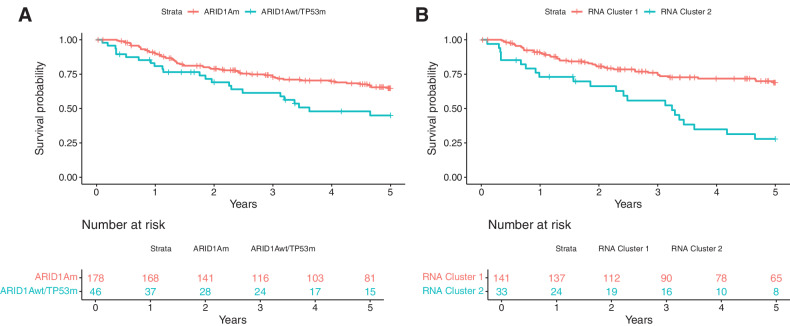
Results: We detected a putative somatic driver mutation in at least one candidate gene in 95% (401/421) of CCOC tumors including ARID1A (in 49% of tumors), PIK3CA (49%), TERT (20%), and TP53 (16%). Clustering of cancer driver mutations and RNA expression converged upon two distinct subclasses of CCOC. The first was dominated by ARID1A-mutated tumors with enriched expression of canonical CCOC genes and markers of platinum resistance; the second was largely comprised of tumors with TP53 mutations and enriched for the expression of genes involved in extracellular matrix organization and mesenchymal differentiation. Compared with the ARID1A-mutated group, women with TP53-mutated tumors were more likely to have advanced-stage disease, no antecedent history of endometriosis, and poorer survival, driven by their advanced stage at presentation. In women with ARID1A-mutated tumors, there was a trend toward a lower rate of response to first-line platinum-based therapy.
Conclusions: Our study suggests that CCOC consists of two distinct molecular subclasses with distinct clinical presentation and outcomes, with potential relevance to both traditional and experimental therapy responsiveness. See related commentary by Lheureux, p. 4838.
©2022 The Authors; Published by the American Association for Cancer Research.
Figures
Comment in
-
Multi-omics Uncovering Different Faces of Clear Cell Ovarian Cancer.Clin Cancer Res. 2022 Nov 14;28(22):4838-4839. doi: 10.1158/1078-0432.CCR-22-2365. Clin Cancer Res. 2022. PMID: 36094332
Similar articles
-
Genome-wide DNA methylation in relation to ARID1A deficiency in ovarian clear cell carcinoma.J Transl Med. 2024 Jun 10;22(1):556. doi: 10.1186/s12967-024-05311-7. J Transl Med. 2024. PMID: 38858765 Free PMC article.
-
Integrated genomic/epigenomic analysis stratifies subtypes of clear cell ovarian carcinoma, highlighting their cellular origin.Sci Rep. 2024 Aug 13;14(1):18797. doi: 10.1038/s41598-024-69796-4. Sci Rep. 2024. PMID: 39138354 Free PMC article.
-
CCNE1 copy-number gain and overexpression identify ovarian clear cell carcinoma with a poor prognosis.Mod Pathol. 2017 Feb;30(2):297-303. doi: 10.1038/modpathol.2016.160. Epub 2016 Oct 21. Mod Pathol. 2017. PMID: 27767100
-
Precision medicine for ovarian clear cell carcinoma based on gene alterations.Int J Clin Oncol. 2020 Mar;25(3):419-424. doi: 10.1007/s10147-020-01622-z. Epub 2020 Feb 4. Int J Clin Oncol. 2020. PMID: 32020380 Review.
-
Clinical analysis and literature review of a case of ovarian clear cell carcinoma with PIK3CA gene mutation: A case report.Medicine (Baltimore). 2022 Sep 16;101(37):e30666. doi: 10.1097/MD.0000000000030666. Medicine (Baltimore). 2022. PMID: 36123851 Free PMC article. Review.
Cited by
-
Dual blockade of BRD4 and ATR/WEE1 pathways exploits ARID1A loss in clear cell ovarian cancer.Res Sq [Preprint]. 2023 Sep 27:rs.3.rs-3314138. doi: 10.21203/rs.3.rs-3314138/v1. Res Sq. 2023. PMID: 37841875 Free PMC article. Preprint.
-
Genome-wide DNA methylation in relation to ARID1A deficiency in ovarian clear cell carcinoma.J Transl Med. 2024 Jun 10;22(1):556. doi: 10.1186/s12967-024-05311-7. J Transl Med. 2024. PMID: 38858765 Free PMC article.
-
HER2 status as a potential predictive biomarker for ovarian clear cell carcinoma.Virchows Arch. 2023 Oct;483(4):497-507. doi: 10.1007/s00428-023-03640-4. Epub 2023 Sep 7. Virchows Arch. 2023. PMID: 37676270
-
H2Bub1 loss is an early contributor to clear cell ovarian cancer progression.JCI Insight. 2023 Jun 22;8(12):e164995. doi: 10.1172/jci.insight.164995. JCI Insight. 2023. PMID: 37345659 Free PMC article.
-
Selective Alanine Transporter Utilization is a Therapeutic Vulnerability in ARID1A-Mutant Ovarian Cancer.Cancer Res. 2025 Jul 14:10.1158/0008-5472.CAN-25-0654. doi: 10.1158/0008-5472.CAN-25-0654. Online ahead of print. Cancer Res. 2025. PMID: 40658600 Free PMC article.
References
MeSH terms
Grants and funding
LinkOut - more resources
Full Text Sources
Medical
Research Materials
Miscellaneous
