. 2022 Sep;159(2):261-270.
doi: 10.1007/s11060-022-04060-1. Epub 2022 Jul 11.

IDH1 p.R132H ctDNA and D-2-hydroxyglutarate as CSF biomarkers in patients with IDH-mutant gliomas

Affiliations

IDH1 p.R132H ctDNA and D-2-hydroxyglutarate as CSF biomarkers in patients with IDH-mutant gliomas

Yoko Fujita et al. J Neurooncol. 2022 Sep.

Abstract

Introduction: We aimed to evaluate IDH1 p.R132H mutation and 2-hydroxyglutarate (2HG) in cerebrospinal fluid (CSF) as biomarkers for patients with IDH-mutant gliomas.

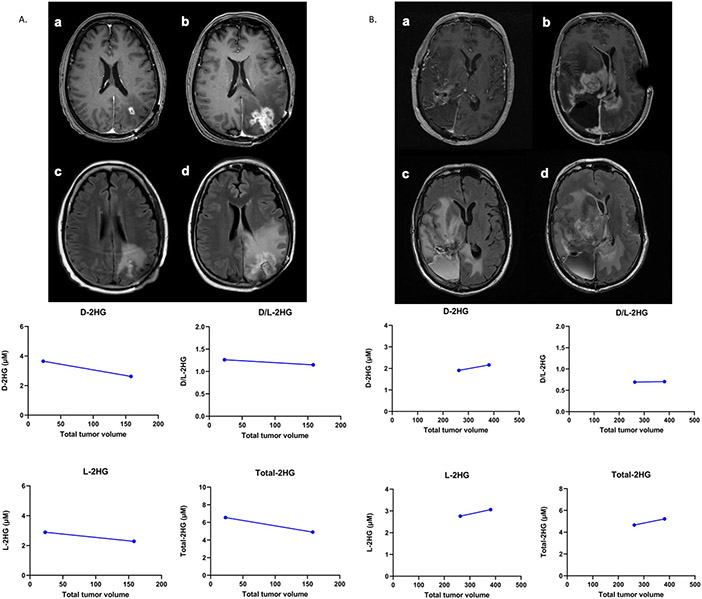
Methods: CSF was collected from patients with infiltrating glioma, and 2HG levels were measured by liquid chromatography-mass spectrometry. IDH1 p.R132H mutant allele frequency (MAF) in CSF-ctDNA was measured by digital droplet PCR (ddPCR). Tumor volume was measured from standard-of-care magnetic resonance images.

Results: The study included 48 patients, 6 with IDH-mutant and 42 with IDH-wildtype gliomas, and 57 samples, 9 from the patients with IDH-mutant and 48 from the patients with IDH-wildtype gliomas. ctDNA was detected in 7 of the 9 samples from patients with IDH-mutant glioma, and IDH1 p.R132H mutation was detected in 5 of the 7 samples. The MAF ranged from 0.3 to 39.95%. Total 2HG level, D-2HG level, and D/L-2HG ratio in CSF were significantly higher in patients with IDH-mutant gliomas than in patients with IDH-wildtype gliomas. D-2HG level and D/L-2HG ratio correlated with total tumor volume in patients with IDH-mutant gliomas but not in patients with IDH-wildtype gliomas.

Conclusion: Our results suggest that detection of IDH1 p.R132H mutation by ddPCR and increased D-2HG level in CSF may help identify IDH-mutant gliomas. Our results also suggest that D-2HG level and D/L-2HG ratio correlate with tumor volume in patients with IDH-mutant gliomas. Further prospective studies with larger cohorts are needed to validate these findings.

Keywords: Astrocytoma; Cerebrospinal fluid; Circulating tumor DNA; D-2-hydroxyglutarate (D-2HG); Gliomas; IDH1; Oligodendroglioma.


Conflict of interest statement

Conflict of interest None of the authors has any conflicts to declare.

Figures

Fig. 1
Fig. 1
IDH1 p.R132H mutation detection in CSF-cfDNA by ddPCR. A Representative 2-dimensional plot of the ddPCR analysis of IDH1 p.R132H mutation in CSF cfDNA (sample 5–2). The pink lines indicate the intensity threshold. The blue dots surrounded by blue circle in the upper-left quadrant indicate the mutant IDH1 p.R132H signal. The green dots surrounded by green circle in the lower-right quadrant indicate the wildtype IDH1 allele signal. The grey dots in the lower-left quadrant indicate the background signal. The IDH1 p. R132H MAF was 39.95% (positive droplets represented by blue dots in upper left quadrant). B IDH1 p.R132H MAF in CSF-cfDNA by ddPCR for the 9 IDH-mutant samples. Sample 1 is from a patient with an IDH1 p.R132G mutation and is negative for the IDH1 p.R132H mutation as expected. IDH1 p.R132H mutation was not detected in sample 4, and ddPCR analysis failed for samples 6–1 and 6–2. C IDH1 p.R132H MAF vs tumor volume (cm3)
Fig. 2
Fig. 2
Elevated 2HG levels in CSF in patients with IDH-mutant gliomas. Boxplots showing levels of D-2HG (A), L-2HG (B), and total 2HG (C) and D/L-2HG ratio (D) in CSF samples from patients with IDH-mutant (9 samples from 6 patients) and IDH-wildtype (48 samples from 42 patients) gliomas
Fig. 3
Fig. 3
Levels of 2HG in CSF correlate with tumor volume in patients with IDH-mutant glioma. Representative MR images acquired within 30 days of CSF collection are shown. A Patient 5. Contrast-enhanced T1-weighted images and FLAIR images of timepoint 1 (a, d), timepoint 2 (4 months after timepoint 1, b, e), and timepoint 3 (3 months after timepoint 2, c, f). A contrast enhancing lesion has appeared on timepoint 3, indicated by the white arrow (c). FLAIR signal changes have worsened over time along the white matter of the frontal, temporal and insular lobes as well as the thalamus (d–f). Each dot in the graph represents each timepoint shown in the MR images above. There is a correlation between CNS tumor volume and D-2HG level and D/L-2HG ratio in CSF. B Patient 6. Contrast-enhanced T1-weighted images and FLAIR images of timepoint 1 (a, c) and timepoint 2 (4 months after timepoint 1, b, d). Contrast enhancing lesions are indicated by white arrows. The small contrast enhancing periventricular lesions in timepoint 1 (a), increased in size in timepoint 2 (b). Furthermore, there was progression of a new enhancing lesion in the corpus callosum along the left periventricular area in timepoint 2 (b), indicated by the white arrowhead. Accordingly, FLAIR signal changes have increased in size over time. In this case, there are positive correlations between D-2HG, L-2HG, total-2HG, and D/L-2HG ratio and tumor volume even though the increase in tumor volume was small
Fig. 4
Fig. 4
Levels of 2HG in CSF are stable despite tumor growth in patients with IDH-wildtype gliomas. A Patient 9. Contrast-enhanced T1-weighted images and FLAIR images of timepoint 1 (a, c) and timepoint 2 (3 months after timepoint 1, b, d). A small contrast enhancing lesion with corresponding FLAIR signal changes in the left parietal lobe (a, c), with significant increase in size in timepoint 2 (b, d). Each dot in the graph represents each timepoint shown in the MR images above. D-2HG, L-2HG, total-2HG, and D/L-2HG ratio remained relatively stable during tumor progression. B Patient 11. Contrast-enhanced T1-weighted images and FLAIR images of timepoint 1 (a, c) and timepoint 2 (2 months after timepoint 1, b, d). D-2HG, L-2HG, total-2HG, and D/L-2HG ratio remained relatively stable in the presence of significant increase in tumor burden

References

    1. Parsons DW, Jones S, Zhang X et al. (2008) An integrated genomic analysis of human glioblastoma multiforme. Science 321:1807–1812. 10.1126/science.1164382 - DOI - PMC - PubMed
    1. Yan H, Parsons W, Jin G et al. (2009) IDH1 and IDH2 mutations in gliomas. N Engl J Med 8:765–773 - PMC - PubMed
    1. Paschka P, Schlenk RF, Gaidzik VI et al. (2010) IDH1 and IDH2 mutations are frequent genetic alterations in acute myeloid leukemia and confer adverse prognosis in cytogenetically normal acute myeloid leukemia with NPM1 mutation without FLT3 internal tandem duplication. J Clin Oncol 28:3636–3643. 10.1200/jco.2010.28.3762 - DOI - PubMed
    1. Borger DR, Tanabe KK, Fan KC et al. (2012) Frequent mutation of isocitrate dehydrogenase (IDH)1 and IDH2 in cholangiocarcinoma identified through broad-based tumor genotyping. Oncology 17:72–79. 10.1634/theoncologist.2011-0386 - DOI - PMC - PubMed
    1. Dang L, White DW, Gross S et al. (2009) Cancer-associated IDH1 mutations produce 2-hydroxyglutarate. Nature 462:739–744. 10.1038/nature08617 - DOI - PMC - PubMed

LinkOut - more resources