. 2023 Jan;33(1):e13108.
doi: 10.1111/bpa.13108. Epub 2022 Jul 11.

TREM2-induced activation of microglia contributes to synaptic integrity in cognitively intact aged individuals with Alzheimer's neuropathology

Affiliations

TREM2-induced activation of microglia contributes to synaptic integrity in cognitively intact aged individuals with Alzheimer's neuropathology

Anna Fracassi et al. Brain Pathol. 2023 Jan.

Abstract

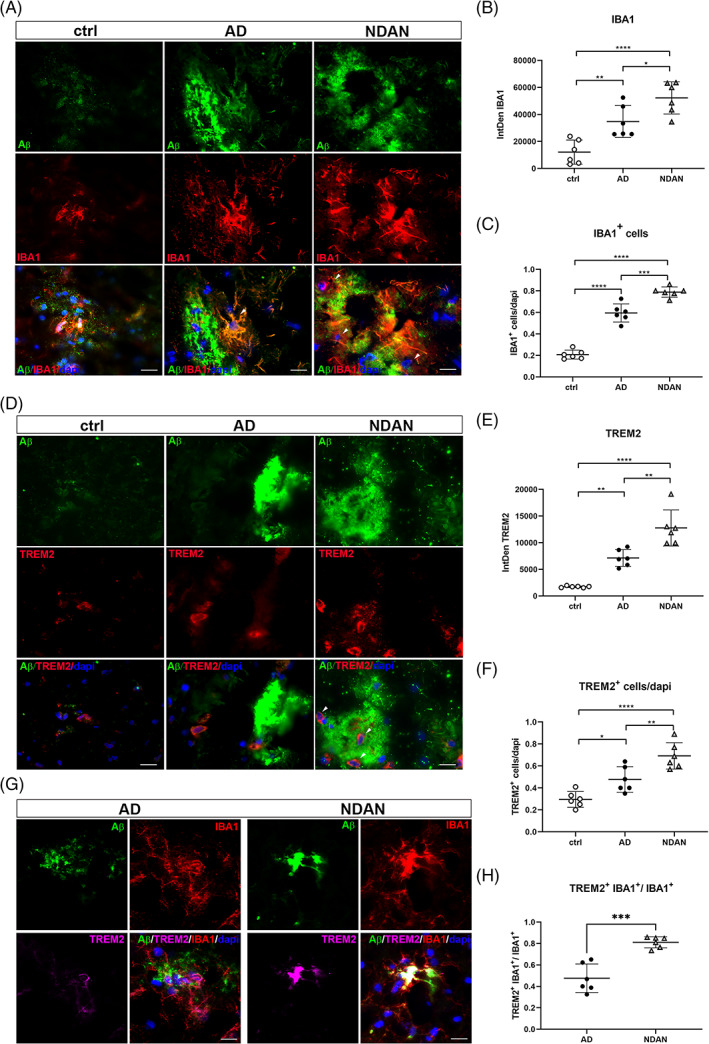
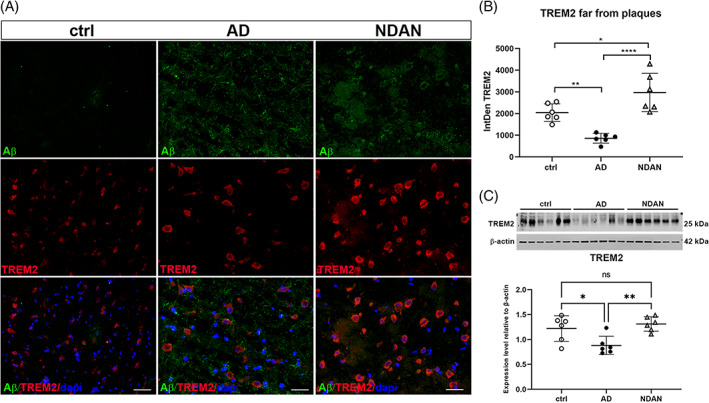
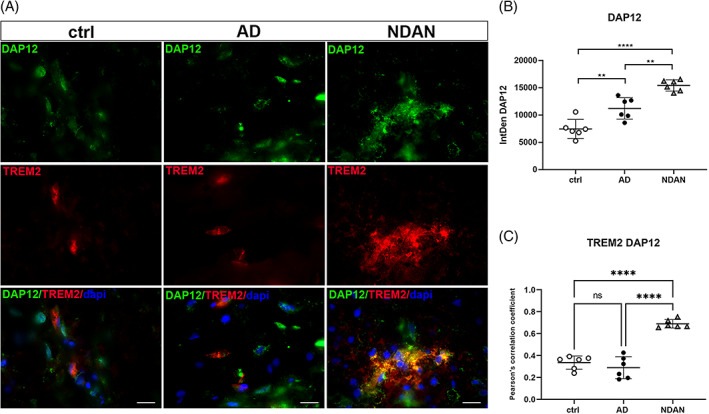
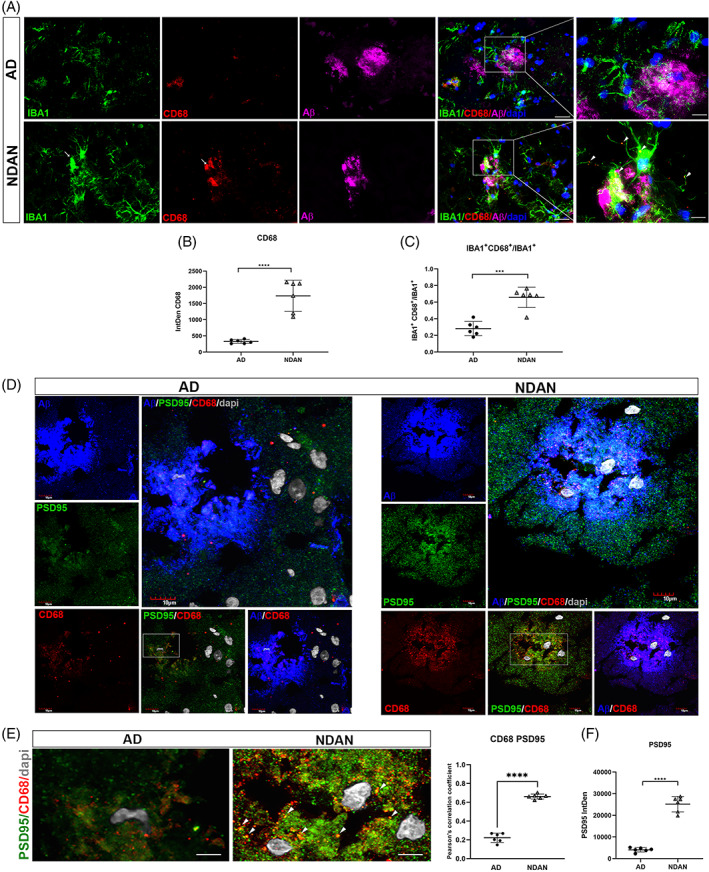
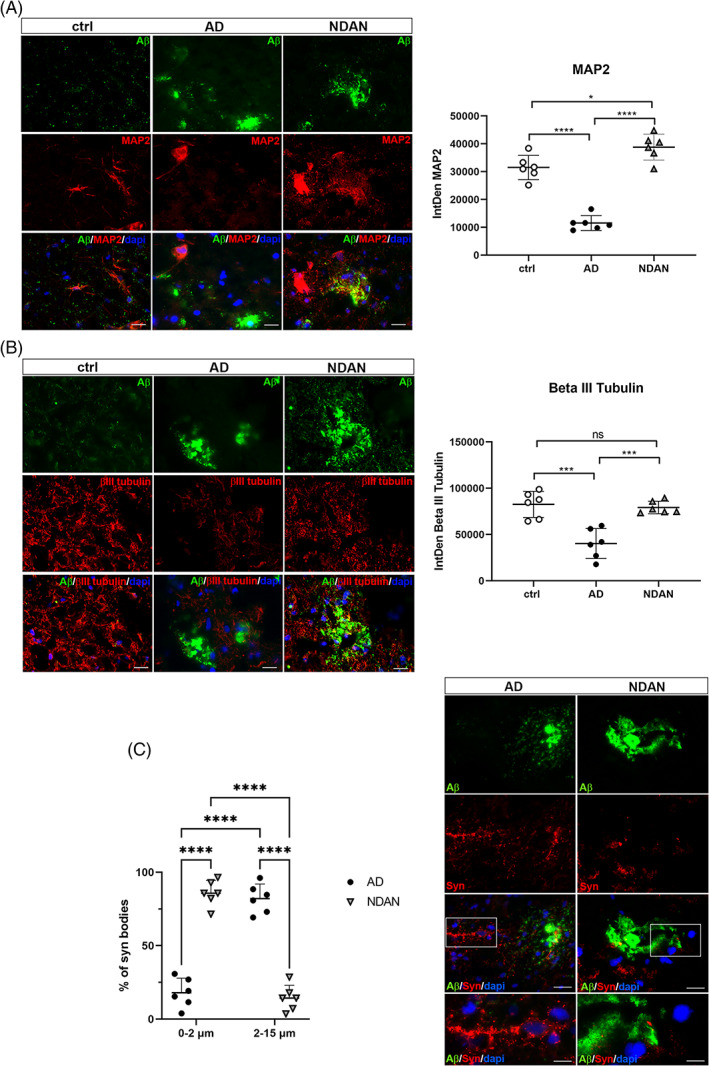
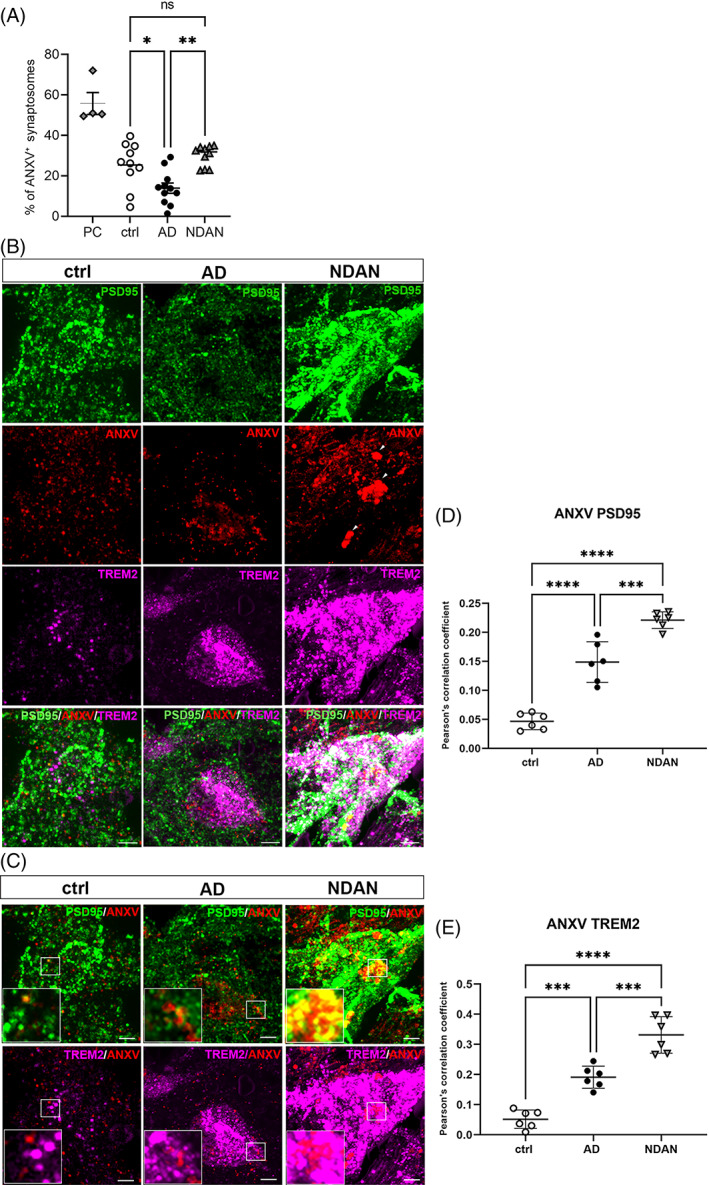
The existence of individuals who remain cognitively intact despite presenting histopathological signs of Alzheimer's disease (AD), here referred to as "Nondemented with AD neuropathology" (NDAN), suggests that some mechanisms are triggered to resist cognitive impairment. Exposed phosphatidylserine (ePS) represents a neuronal "eat-me" signal involved in microglial-mediated phagocytosis of damaged synapses. A possible mediator of this process is TREM2, a microglial surface receptor activated by ligands including PS. Based on TREM2 role in the scavenging function of microglia, we hypothesize that an efficient microglial phagocytosis of damaged synapses underlies synaptic resilience in NDAN, thus protecting from memory deficits. Using immunofluorescence microscopy, we performed a comparative study of human post-mortem frontal cortices of aged-matched, AD and NDAN individuals. We studied the distribution of activated microglia (IBA1, IBA1+ /CD68+ cells) and phagocytic microglia-related proteins (TREM2, DAP12), demonstrating higher microglial activation and TREM2 expression in NDAN versus AD. A study of the preservation of synapses around plaques, assessed using MAP2 and βIII tubulin as dendritic and axonal markers, respectively, and PSD95 as a postsynaptic marker, revealed preserved axonal/dendritic structure around plaques in NDAN versus AD. Moreover, high levels of PSD95 around NDAN plaques and the colocalization of PSD95 with CD68 indicated a prompt removal of damaged synapses by phagocytic microglia. Furthermore, Annexin V assay on aged-matched, AD and NDAN individuals synaptosomes revealed increased levels of ePS in NDAN, confirming damaged synapses engulfment. Our results suggest a higher efficiency of TREM2-induced phagocytic microglia in removing damaged synapses, underlying synaptic resilience in NDAN individuals.

Keywords: Alzheimer's disease; TREM2; microglia; phosphatidylserine; resilience; synapses.


Conflict of interest statement

The authors declare no competing financial interests.

Figures

FIGURE 1
FIGURE 1
Expression and distribution of IBA1 and TREM2 in relation to β‐amyloid (Aβ) plaques in age‐matched, Alzheimer's disease (AD), and Nondemented with AD neuropathology (NDAN) subjects. (A–C) Double immunofluorescence (IF) showing higher distribution of microglial cells (red) around Aβ plaques (green) in NDAN individuals as compared to AD and controls. White arrowheads indicate microglia attacking amyloid deposits in AD and NDAN. Scale bar 30 μm. Quantitative analyses of images show significantly increased IntDen levels of IBA1 and number of IBA+ cells in NDAN versus AD and controls. Statistical analyses were made using one‐way analysis of variance (ANOVA), followed by Tukey's multiple‐comparisons test. Values are expressed as the mean ± SD. (B) Ctrl versus. AD ** p = 0.0074; AD versus NDAN * p = 0.0369; ctrl versus. NDAN **** p < 0.0001. (C) Ctrl versus AD **** p < 0.0001; AD versus NDAN *** p = 0.0002; ctrl versus NDAN **** p < 0.0001. (D–F) double IF staining showing higher distribution of TREM2 (red) around Aβ plaques (green) in NDAN individuals as compared to AD and controls subjects. Images and quantitative analyses show increased number of TREM2+ cells surrounding plaques in NDAN versus. AD. Scale bar 30 μm. Statistical analyses were made using one‐way ANOVA, following Tukey's multiple‐comparisons test. Values are expressed as the mean ± SD. (E) Ctrl versus AD ** p = 0.0016; AD versus NDAN ** p = 0.0011; ctrl versus NDAN **** p < 0.0001. (F) Ctrl versus AD * p = 0.0232; AD versus NDAN ** p = 0.0078; ctrl versus NDAN **** p < 0.0001. (G,H) triple IF and quantitative analyses showing higher number of TREM2 + (magenta) IBA+ (green) cells over the total number of microglia in NDAN than in AD subjects around Aβ plaques. Scale bar 30 μm. Statistical analyses were made using t‐test. Values are expressed as the mean ± SD. AD versus NDAN *** p = 0.0002
FIGURE 2
FIGURE 2
Expression and distribution of TREM2 far from plaques in age‐matched, Alzheimer's disease (AD), and Nondemented with AD neuropathology (NDAN) subjects. (A,B) Representative images of double immunofluorescence (IF) staining of TREM2 (red) and β‐amyloid (Aβ) (green) and quantitative analyses showing higher overall distribution of TREM2 in NDAN individuals as compared to AD and controls subjects even far from Aβ plaques. AD patients show significantly low levels of TREM2 as respect to controls and NDAN. Scale bar 30 μm. (C) WB analyses of human frontal cortices confirming the significantly decreased levels of TREM2 in AD patients as respect to aged‐matched and NDAN individuals. Statistical analyses were made using one‐way analysis of variance, following Tukey's multiple‐comparisons test. Values are expressed as the mean ± SD. (B) Ctrl versus AD ** p = 0.0076; AD versus NDAN **** p < 0.0001; ctrl versus NDAN * p = 0.0345. (C) Ctrl versus AD p = 0.0270; AD versus NDAN * p = 0.0056; ctrl versus NDAN p = 0.7168
FIGURE 3
FIGURE 3
Expression and distribution of DAP12 and colocalization with TREM2 in aged‐matched, Alzheimer's disease (AD), and Nondemented with AD neuropathology (NDAN) subjects. (A,B) Immunofluorescence (IF) staining and quantitative analysis showing increased distribution of DAP12 (green) in AD and NDAN individuals as compared to controls subjects. (A–C) Double staining with TREM2 (red) and Pearson's correlation coefficient analysis showing increased levels of colocalization in NDAN versus AD and control subjects. Statistical analyses were made using one‐way analysis of variance, followed by Tukey's multiple‐comparisons test. Values are expressed as the mean ± SD. B) Ctrl versus AD ** p = 0.0031; AD versus NDAN ** p = 0.0012; p < 0.01; ctrl versus NDAN **** p < 0.0001. C) Ctrl versus AD p = 0.5078; AD versus NDAN **** p < 0.0001; ctrl versus NDAN **** p < 0.0001
FIGURE 4
FIGURE 4
Expression and distribution of phagocytic microglia and engulfed synapses in relation to β‐amyloid (Aβ) plaques in Alzheimer's disease (AD) and Nondemented with AD neuropathology (NDAN) individuals. (A) Triple immunofluorescence (IF) of IBA1 (green) in combination with CD68 (red) and Aβ (magenta) showing significantly increased levels of activated microglia in NDAN individuals. Scale bar 30 μm. Higher magnification images showing highly phagocytic macroglia surrounding NDAN plaques. Microglial lysosomes are indicated with white arrowheads. Scale bar 10 μm. (B) Quantitative analyses of total CD68 levels, (C) and the counting of microglial cells positive to CD68 confirming the presence of highly phagocytic microglia in NDAN versus AD around plaques. Statistical analyses were made using t‐test. Values are expressed as the mean ± SD. (B) **** p < 0.0001; (C) *** p = 0.0001. (D) Confocal images of AD and NDAN FC confirming higher immunoreactivity levels of CD68 (red) in NDAN versus AD indicating the presence of activated microglia in the proximity of Aβ plaques (blue). (E) Higher magnification images and Pearson's correlation coefficient analysis demonstrate significantly higher colocalization levels between CD68 and PSD95 in NDAN as compared to AD FC. The white arrows indicate the engulfment of synapses (green) by the microglial lysosomes (red) in NDAN. Statistical analyses were made using t‐test. Values are expressed as the mean ± SD. **** p < 0.0001. Scale bar 10 μm. (F) NDAN microglia phagocytic activity in removing damaged synapses is supported by the significantly higher levels of PSD95 in NDAN versus AD near Aβ plaques. Statistical analyses were made using t‐test. Values are expressed as the mean ± SD. **** p < 0.0001
FIGURE 5
FIGURE 5
Expression and distribution of axonal and dendritic markers in aged‐matched, Alzheimer's disease (AD), and Nondemented with AD neuropathology (NDAN) subjects. (A) Double immunofluorescence (IF) staining and quantitative analysis showing higher distribution of MAP2 (red) around β‐amyloid (Aβ) plaques (green) in NDAN individuals as compared to AD and control subjects. Scale bar 30 μm. (B) Double IF staining and quantitative analysis demonstrating higher distribution of βIII tubulin (red) around Aβ plaques (green) in NDAN individuals as compared to AD. (C) Representative images of double staining of Syn (red) in combination with Aβ (green) (scale bar 30 μm) and higher magnification micrographs (scale bar 10 μm). Quantitative analyses of the size of syn bodies confirmed NDAN axonal integrity. Statistical analyses were made using one‐way analysis of variance, followed by Tukey's multiple‐comparisons test. Values are expressed as the mean ± SD. (A) Ctrl versus AD **** p < 0.0001; AD versus NDAN **** p < 0.0001; ctrl versus NDAN * p < 0.0168. (B) Ctrl versus AD *** p = 0.0001; AD versus NDAN ***p = 0.0003; ctrl versus NDAN p = 0.8983. C) Statistical analyses were made using t‐test. Values are expressed as the mean ± SD. **** p < 0.0001
FIGURE 6
FIGURE 6
Evaluation of exposed phosphatidylserine in control, Alzheimer's disease (AD), and Nondemented with AD neuropathology (NDAN) frontal cortices (FC). (A) Flowcytometry ANXV assay of human synaptosomes isolated from FC of aged‐matched, AD and NDAN individuals showing significantly increased percentage of intact synaptosomes positive for ANXV in NDAN as compared to AD subjects. Statistical analyses were made using one‐way ANOVA, following Tukey's multiple‐comparisons test. Values are expressed as the mean ± SD. Ctrl versus AD * p = 0.0279; AD versus NDAN ** p = 0.0014; ctrl versus NDAN p = 06733. PC, positive control. (B,C) Representative images of triple immunofluorescence staining of PSD95 (green) in combination with ANXV (red) and TREM2 (magenta) of age‐matched, AD, and NDAN subjects, showing increased levels of ANXV, PSD95 and TREM2 and the colocalization (white) among these three markers in NDAN individuals. Scale bar 5 μm. (D,E) Pearson's correlation coefficient analyses of colocalization show increased levels of colocalization between ANXV and either PSD95 or TREM2 in NDAN as compared to AD and controls. Statistical analyses were made using one‐way analysis of variance, following Tukey's multiple‐comparisons test. Values are expressed as the mean ± SD. (D) Ctrl versus AD **** p < 0.0001; AD versus NDAN *** p = 0.0002; ctrl versus NDAN **** p < 0.0001. (E) Ctrl versus AD *** p = 0.0002; AD versus NDAN *** p = 0.0002; ctrl versus NDAN **** p < 0.0001

Similar articles

Cited by

References

    1. 2022 Alzheimer's disease facts and figures. Alzheimers Dement. 2022;18(4):700–89. - PubMed
    1. Jack CR Jr, Bennett DA, Blennow K, Carrillo MC, Dunn B, Haeberlein SB, et al. NIA‐AA research framework: toward a biological definition of Alzheimer's disease. Alzheimers Dement. 2018;14(4):535–62. - PMC - PubMed
    1. Zolochevska O, Bjorklund N, Woltjer R, Wiktorowicz JE, Taglialatela G. Postsynaptic proteome of non‐demented individuals with Alzheimer's disease neuropathology. J Alzheimers Dis. 2018;65(2):659–82. - PMC - PubMed
    1. Zolochevska O, Taglialatela G. Selected microRNAs increase synaptic resilience to the damaging binding of the Alzheimer's disease amyloid Beta oligomers. Mol Neurobiol. 2020;57(5):2232–43. - PMC - PubMed
    1. Bjorklund NL, Reese LC, Sadagoparamanujam VM, Ghirardi V, Woltjer RL, Taglialatela G. Absence of amyloid β oligomers at the postsynapse and regulated synaptic Zn2+ in cognitively intact aged individuals with Alzheimer's disease neuropathology. Mol Neurodegener. 2012;7:23. - PMC - PubMed

Publication types