

The DNA Landscape: Development and Application of a New Framework for Visual Communication about DNA
- PMID: 35816448
- PMCID: PMC9582814
- DOI: 10.1187/cbe.22-01-0007
The DNA Landscape: Development and Application of a New Framework for Visual Communication about DNA
Abstract
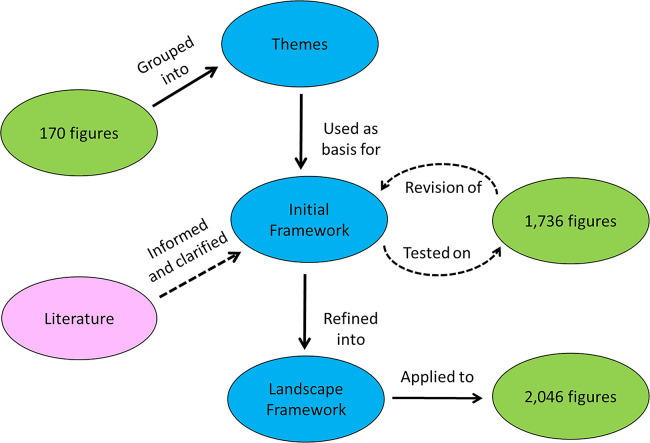
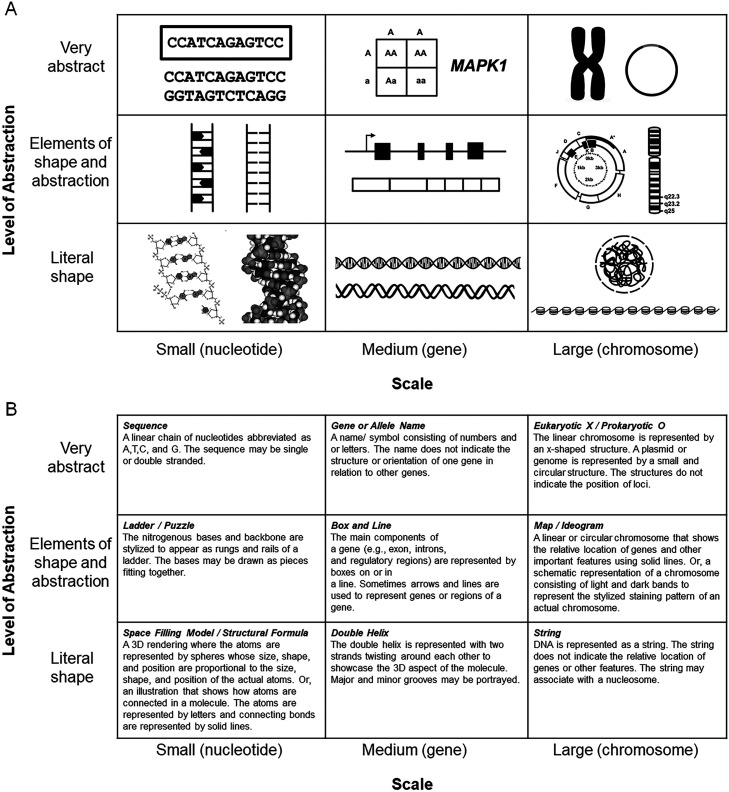
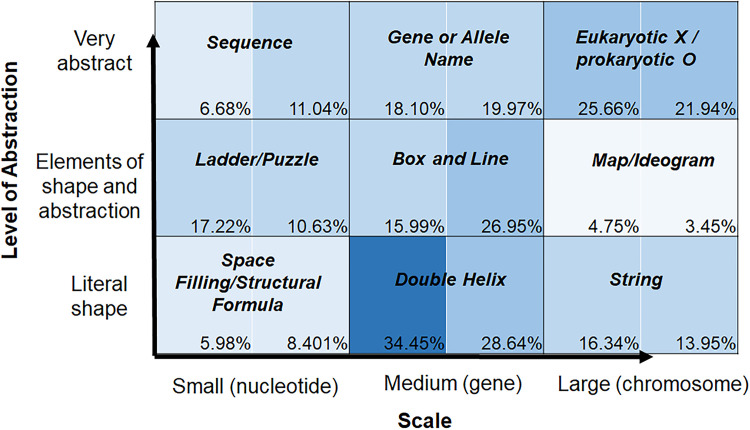
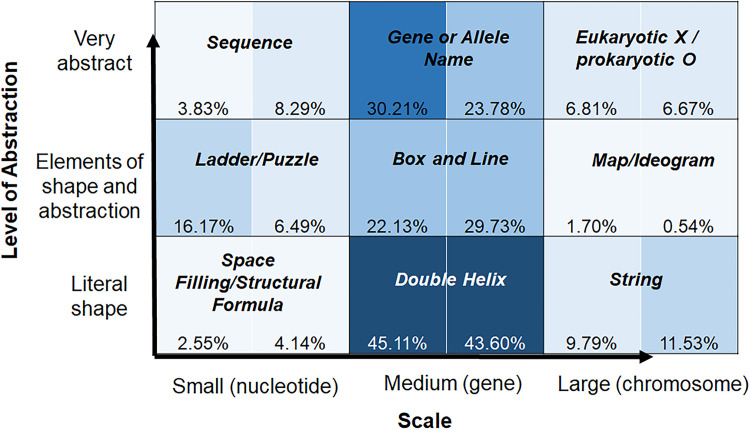
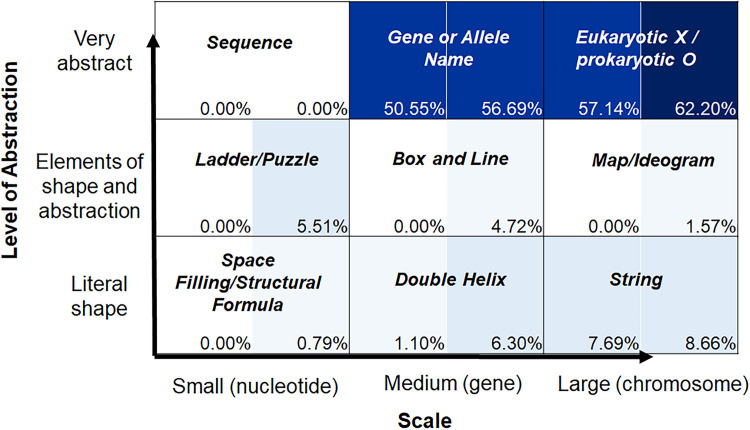
Learning molecular biology involves using visual representations to communicate ideas about largely unobservable biological processes and molecules. Genes and gene expression cannot be directly visualized, but students are expected to learn and understand these and related concepts. Theoretically, textbook illustrations should help learners master such concepts, but how are genes and other DNA-linked concepts illustrated for learners? We examined all DNA-related images found in 12 undergraduate biology textbooks to better understand what biology students encounter when learning concepts related to DNA. Our analysis revealed a wide array of DNA images that were used to design a new visual framework, the DNA Landscape, which we applied to more than 2000 images from common introductory and advanced biology textbooks. All DNA illustrations could be placed on the landscape framework, but certain positions were more common than others. We mapped figures about "gene expression" and "meiosis" onto the landscape framework to explore how these challenging topics are illustrated for learners, aligning these outcomes with the research literature to showcase how the overuse of certain representations may hinder, instead of help, learning. The DNA Landscape is a tool to promote research on visual literacy and to guide new learning activities for molecular biology.
Figures
Similar articles
-
Visual Literacy of Molecular Biology Revealed through a Card-Sorting Task.J Microbiol Biol Educ. 2023 Jan 31;24(1):e00198-22. doi: 10.1128/jmbe.00198-22. eCollection 2023 Apr. J Microbiol Biol Educ. 2023. PMID: 37089244 Free PMC article.
-
The DNA Triangle and Its Application to Learning Meiosis.CBE Life Sci Educ. 2017 Fall;16(3):ar50. doi: 10.1187/cbe.17-03-0046. CBE Life Sci Educ. 2017. PMID: 28798212 Free PMC article.
-
Arrows in Biology: Lack of Clarity and Consistency Points to Confusion for Learners.CBE Life Sci Educ. 2017 Dec 1;17(1):ar6. doi: 10.1187/cbe.17-04-0069. CBE Life Sci Educ. 2017. PMID: 29351909 Free PMC article.
-
Supporting students in developing literacy in science.Science. 2010 Apr 23;328(5977):456-9. doi: 10.1126/science.1182593. Science. 2010. PMID: 20413490 Review.
-
The essence of student visual-spatial literacy and higher order thinking skills in undergraduate biology.Protoplasma. 2012 Feb;249 Suppl 1:S25-30. doi: 10.1007/s00709-011-0346-6. Epub 2011 Nov 3. Protoplasma. 2012. PMID: 22048638 Review.
Cited by
-
Biology exams rarely use visual models to engage higher-order cognitive skills.PLoS One. 2025 Jul 2;20(7):e0317077. doi: 10.1371/journal.pone.0317077. eCollection 2025. PLoS One. 2025. PMID: 40601675 Free PMC article.
-
Probing visual literacy skills reveals unexpected student conceptions of chromosomes.bioRxiv [Preprint]. 2024 Nov 4:2024.09.20.614153. doi: 10.1101/2024.09.20.614153. bioRxiv. 2024. Update in: CBE Life Sci Educ. 2025 Mar 01;24(1):ar17. doi: 10.1187/cbe.24-07-0176. PMID: 39386485 Free PMC article. Updated. Preprint.
-
Probing Visual Literacy Skills Reveals Unexpected Student Conceptions of Chromosomes.CBE Life Sci Educ. 2025 Mar 1;24(1):ar17. doi: 10.1187/cbe.24-07-0176. CBE Life Sci Educ. 2025. PMID: 39982982 Free PMC article.
-
Visual Literacy of Molecular Biology Revealed through a Card-Sorting Task.J Microbiol Biol Educ. 2023 Jan 31;24(1):e00198-22. doi: 10.1128/jmbe.00198-22. eCollection 2023 Apr. J Microbiol Biol Educ. 2023. PMID: 37089244 Free PMC article.
References
-
- Airey, J., Linder, C. (2009). A disciplinary discourse perspective on university science learning: Achieving fluency in a critical constellation of modes. Journal of Research in Science Teaching, 46, 27–49. https://doi.org/10.1002/tea.20265
-
- American Association for the Advancement of Science. (2011). Vision and change in undergraduate biology education: A call to action Washington, DC.
-
- Anderson, T. R., Schönborn, K. J., du Plessis, L., Gupthar, A. S., Hull, T. L. (2013). Identifying and developing students’ ability to reason with concepts and representations in biology. In Treagust, D. F., Tsui, C.-Y. (Eds.), Multiple representations in biological education (pp. 19–38). Dordrecht, Netherlands: Springer.
-
- Angra, A., Gardner, S. M. (2017). Reflecting on graphs: Attributes of graph choice and construction practices in biology. CBE—Life Sciences Education, 16, ar53. https://doi.org/10.1187/cbe.16-08-0245 - PMC - PubMed
-
- Arneson, J. B., Offerdahl, E. G. (2018). Visual literacy in Bloom: Using Bloom's taxonomy to support visual learning skills. CBE—Life Sciences Education, 17, ar7. https://doi.org/10.1187/cbe.17-08-0178 - PMC - PubMed
Publication types
MeSH terms
Substances
Grants and funding
LinkOut - more resources
Full Text Sources
